

Guide: How-to
Melhoria da Qualidade do Serviço: Um Roteiro Alimentado por IA
NILG.AI · 3 de agosto de 2026
A sua equipa já conhece a sensação. Um cliente diz que o trabalho está bem, mas as renovações são fracas, os tempos de resposta caem, e o feedback que vem dos gestores de conta é confuso, contraditório e impossível de organizar manualmente. Alguém na liderança diz então "melhora a qualidade do serviço", como se fosse uma ação singular em vez de um modelo operacional.
Não é uma métrica vaga. A melhoria da qualidade do serviço é como protege a receita, a retenção e a sua posição competitiva quando o próprio serviço é o produto. Experiências de cliente deficientes em todo o mundo geram 3,7 biliões em risco de vendas, 43% dos clientes dizem que o mau serviço os desencorajou de comprar à marca novamente, e 75% dizem que gastarão mais em marcas que ofereçam boa experiência de cliente, de acordo com as estatísticas de atendimento ao cliente de 2025 da HubSpot. No mesmo conjunto de dados, o padrão de serviço é também operacional, não sentimental. Os clientes exigem velocidade, e castigam a variação.
É por isso que esta disciplina tem raízes na gestão estruturada da qualidade, não no polimento de marketing. O lingage histórico passa pelos sistemas de qualidade de serviço e fabrica do final do século XX, quando os líderes começaram a medir o desempenho com indicadores padronizados em vez de confiar em anedotas. O documento sobre qualidade de serviço da GOV.UK reflete esse passo com clareza, e o conjunto de ferramentas ainda importa, gráficos de controlo, análise de Pareto, diagramas de causa e efeito, histogramas e gráficos de dispersão continuam a ser a forma de reduzir variação e deixar de adivinhar.
Para empresas de consultoria em IA e dados, isto é ainda mais urgente. O seu trabalho é intangível, os seus defeitos ocultam-se em transições, e uma escalada lenta pode envenenar um envolvimento de resto adequado. Se quer que a qualidade do serviço se mantenha em escala, precisa de dados, disciplina de processo e automação que remove variação em vez de a mascarar.
Para equipas que usam IA para aperfeiçoar operações de cliente, este tipo de modelo operacional combina bem com trabalho prático de automação de serviço como IA para atendimento ao cliente.
Por Que a Qualidade do Serviço é Agora uma Alavanca de Receita
A forma mais rápida de desperdiçar um mandato de melhoria da qualidade do serviço é tratá-lo como um projeto de cortesia. Os líderes ouvem queixas sobre respostas lentas, transições inconsistentes ou atualizações vagas de estado e presumem que a solução é tom melhor ou um novo roteiro. Isto é demasiado pequeno. Num negócio de serviços, a experiência de cliente é parte do produto, pelo que mau serviço afeta renovações, expansão e referencialidade simultaneamente.
Por Que o Antigo Modelo de Suporte Falha
O modelo antigo separava "entrega" de "serviço", mas essa divisão falha em consultoria de IA e dados. Os clientes não compram apenas outputs. Compram confiança de que a equipa responderá, explicará e se adaptará sem fricção. Quando os tempos de resposta variam, ou as equipas de conta não conseguem explicar o que está a acontecer, o cliente não vê um problema operacional. Vê um risco de fornecedor.
É por isso que os números importam. A investigação de atendimento ao cliente da HubSpot mostra que mau serviço desencorajará compras repetidas, e experiência forte aumenta gastos. A qualidade do serviço não fica fora do motor de receita. Molda-o.
Regra prática: se um problema de serviço pode afetar a linguagem de renovação, confiança executiva ou cronograma de expansão, pertence à conversa de receita, não apenas à fila de suporte.
Por Que Isto é uma Disciplina de Gestão, Não um Slogan
O ponto histórico importa porque altera a forma como lidera o programa. O trabalho de qualidade amadureceu quando as organizações pararam de tratar o desempenho como anedótico e começaram a usar indicadores padronizados, gráficos de controlo e ferramentas de causa raiz para encontrar pontos de falha. O documento de qualidade de serviço da GOV.UK reflete essa mudança da opinião para medição, e essa é ainda a mentalidade correta para operações de serviço moderno.
Para empresas de IA e dados, a implicação é direta. Não pode melhorar o que só descreve em linguagem de apresentação. Precisa de um sistema de serviço mensurável, e precisa que ele mostre como qualidade de resposta, qualidade de resolução e consistência traduzem em resultados comerciais. Se não está a conectar esses pontos, está a gerir perceção, não desempenho.
Essa mesma lógica operacional encaixa no uso prático de IA, incluindo IA para atendimento ao cliente, onde automação deve reduzir variação em vez de ocultá-la.
Diagnosticar o Seu Estado Atual de Qualidade de Serviço
A maioria dos programas de serviço falham antes de começarem porque os líderes pulam direto para correções. Compram automação, escrevem um novo SLA ou anunciam um objetivo de tempo de resposta antes de saberem onde vivem os defeitos. Isto é ao contrário. O diagnóstico tem de vir primeiro, e tem de ser contínuo.
Construir um Sistema Real de Informação de Qualidade de Serviço
Um sistema utilizável ouve em quatro direções. Primeiro, capture sinais de cliente externo através de inquéritos transacionais, admissão de queixas e registo de consultas. Segundo, ouça clientes de concorrentes através de análise de ganhos e perdas e mystery shopping, porque o mercado dirá onde a sua experiência fica atrás. Terceiro, recolha feedback de cliente interno de equipas de primeira linha, gestores de conta e equipas de entrega. Quarto, use dados de texto aberto, notas de chamada e transcrições como material bruto para análise em vez de esperar por um resumo trimestral.
É aqui que as ferramentas de consultoria de IA ganham o seu espaço. Clustering baseado em NLP pode agrupar milhares de comentários em temas com rapidez suficiente para suportar revisão semanal, e análise de etiqueta de ticket pode expor padrões que ninguém veria numa folha de cálculo. Num envolvimento de consultoria de IA/dados, as queixas de onboarding estavam espalhadas por email, notas de reunião e tickets de suporte até que a análise de transcrição revelou o defeito real, uma transição em falta entre implementação e sucesso de cliente. O problema não era "onboarding lento" em geral, era uma lacuna interna específica que se repetia continuamente.
Trate o Diagnóstico como um Ciclo, Não uma Pesquisa
Uma pesquisa anual é um ritual. Um sistema de qualidade de serviço é um ciclo. O framework de qualidade de serviço do MIT Sloan argumenta para ouvir clientes externos, clientes de concorrentes e clientes internos através de inquéritos transacionais, queixas e consultas, pesquisas de mercado e pesquisas de colaboradores, com ênfase em qualidade de informação sobre volume, que é exatamente a postura correta para equipas de IA e dados que se afogam em feedback não estruturado. A chave é cadência. Recolher dados uma vez por ano dá-lhe um snapshot. Recolhê-los continuamente dá-lhe um sinal de gestão.
Se os líderes dizem que estão a melhorar CSAT mas não conseguem mostrar uma baseline, ainda não estão a gerir qualidade, estão a contar uma história.
O padrão operacional deve ser simples. Cada canal deve alimentar um processo de revisão partilhado, cada tema deve ter um proprietário, e cada sinal deve apontar para uma etapa de processo que pode testar. É assim que o diagnóstico se torna acionável em vez de decorativo.
Definir KPIs Que Realmente Impulsionam Decisões
O maior erro de KPI é óbvio assim que limpou sistemas de serviço suficientes. As equipas rastreiam demasiadas coisas, depois não agem em nenhuma delas. Um painel cheio de totais, médias e métricas de vaidade sente-se produtivo, mas não diz a um gestor o que fazer na segunda-feira de manhã.
Comece com Métricas Críticas para o Cliente
Uma boa árvore de KPI começa com uma ou duas medidas de resultado, depois passa para métricas de processo que as explicam. Na melhoria da qualidade do serviço, essas medidas devem conectar-se diretamente a CTQs, os requisitos críticos para cliente que definem se o serviço pareceu confiável, rápido e sem fricção. Para muitas equipas de consultoria de IA e dados, isto significa métricas ligadas a velocidade de resposta, qualidade de transição, escapes de defeito e esforço.
A tabela abaixo é a versão mais curta em que confiaria numa sessão de trabalho.
| Camada de Métrica | KPI de Exemplo | Decisão Que Dispara |
|---|---|---|
| Resultado | Satisfação do cliente após encerramento de ticket | Se o modelo de serviço se mantém |
| Resultado | Risco de renovação sinalizado por revisão de conta | Se a escalada é necessária agora |
| Processo | Tempo de primeira resposta | Se staffing ou roteamento precisa ajuste |
| Processo | Resolução no primeiro contacto | Se conhecimento, autoridade ou tooling está quebrado |
| Processo | Taxa de escape de defeito por etapa de processo | Qual transição ou etapa de revisão precisa redesenho |
| Indicador Antecipado | Backlog de ticket por canal | Se cobertura de pico é necessária |
| Indicador Antecipado | Taxa de contacto repetido | Se a correção realmente funcionou |
Faça Cada Métrica Job de Alguém
Uma métrica sem proprietário é apenas decoração. Uma métrica sem objetivo é apenas trivialidade. Uma métrica sem decisão anexada é peso morto. É por isso que design de KPI é um ofício de consultoria, não um exercício de painel.
Use as métricas para forçar ação. Se o tempo de primeira resposta cai, o líder de ops altera staffing ou roteamento. Se a resolução no primeiro contacto cai, o líder de entrega fixa acesso a conhecimento ou autoridade. Se escapes de defeito sobem, o proprietário de processo revê a etapa de transição. Mantenha a árvore pequena o suficiente para que as pessoas a possam lembrar e disciplinada o suficiente para que possam discutir sobre ela.
Para empresas de IA e dados, a qualidade do serviço torna-se operacional em vez de cosmética. Não está a perguntar "Os clientes estão felizes?" Está a perguntar "Qual etapa de serviço está a falhar, quem é o proprietário e qual decisão se segue?"
Onde IA e Automação Genuinamente Movem a Agulha
IA melhora a qualidade do serviço apenas quando reduz variação. Se apenas acelera um processo quebrado, automatizou o ruído. É por isso que os casos de uso que vale a pena financiar são mais estreitos do que a maioria dos fornecedores afirma, e o valor vem de combinar a ferramenta com um modo de falha muito específico.
Use análise preditiva quando o picos de procura prejudicam o serviço
A análise preditiva ajuda quando o volume de ticket varia por hora, canal ou segmento de cliente. Numa fila de suporte, isto significa prever picos para que staffing corresponda à procura em vez de reagir após o backlog aparecer. A métrica que levanta é geralmente tempo de primeira resposta, e o modo de falha é fácil de detetar, modelos de staffing construídos em sensação em vez de reconhecimento de padrões.
Use NLP onde o defeito está enterrado em linguagem
NLP é a ferramenta correta quando o problema está oculto em comentários, transcrições de chamadas ou emails. Pode agrupar feedback não estruturado em temas de causa raiz mais rápido do que uma equipa humana consegue etiquetar tudo manualmente. Isto torna-o um ajuste forte para análise de queixa, feedback de onboarding e revisão pós-escalada. O modo de falha é igualmente comum, equipas mineram texto para sentimento e param aí, mesmo que sentimento sozinho não diga qual etapa de processo está quebrada.
Use automação de workflow onde o trabalho é repetitivo e as regras são claras
A automação deve lidar com roteamento, atualizações de estado, verificações de documento e outras tarefas que não precisam julgamento em cada passagem. Na entrega de serviço, isto geralmente melhora tempo de ciclo e reduz erros de transição porque as pessoas deixam de redigitar a mesma informação. Uma regra simples aplica-se, se a tarefa é repetitiva e determinística, automatize. Se precisa contexto ou tratamento de exceção, não force um bot a fingir que é inteligente.
Use recomendações onde agentes precisam da próxima melhor ação
Sistemas de recomendação são úteis quando a equipa precisa orientação no momento de serviço, não depois. Podem sugerir a próxima melhor ação, caminho de escalada provável ou artigo de conhecimento relevante. A métrica que influenciam é consistência, porque agentes deixam de improvisar do zero. O modo de falha a evitar são chatbots brilhantes que ocultam um processo lento em vez de o corrigir.
Se quer um filtro limpo para gastos em IA, use este. IA deve reduzir variação em serviço, não apenas acelerar um processo quebrado. O trabalho da NILG.AI em análise preditiva, automação e software personalizado pode encaixar neste padrão quando o objetivo é remover fricção de um fluxo de trabalho de serviço real, não para sobrepor um modelo num quebrado. Para uma lente de implementação mais ampla, a sua abordagem para automações de IA para empresas alinha-se com essa lógica.
Desenhar Melhorias de Processo Com um Ciclo Primeiro-Piloto
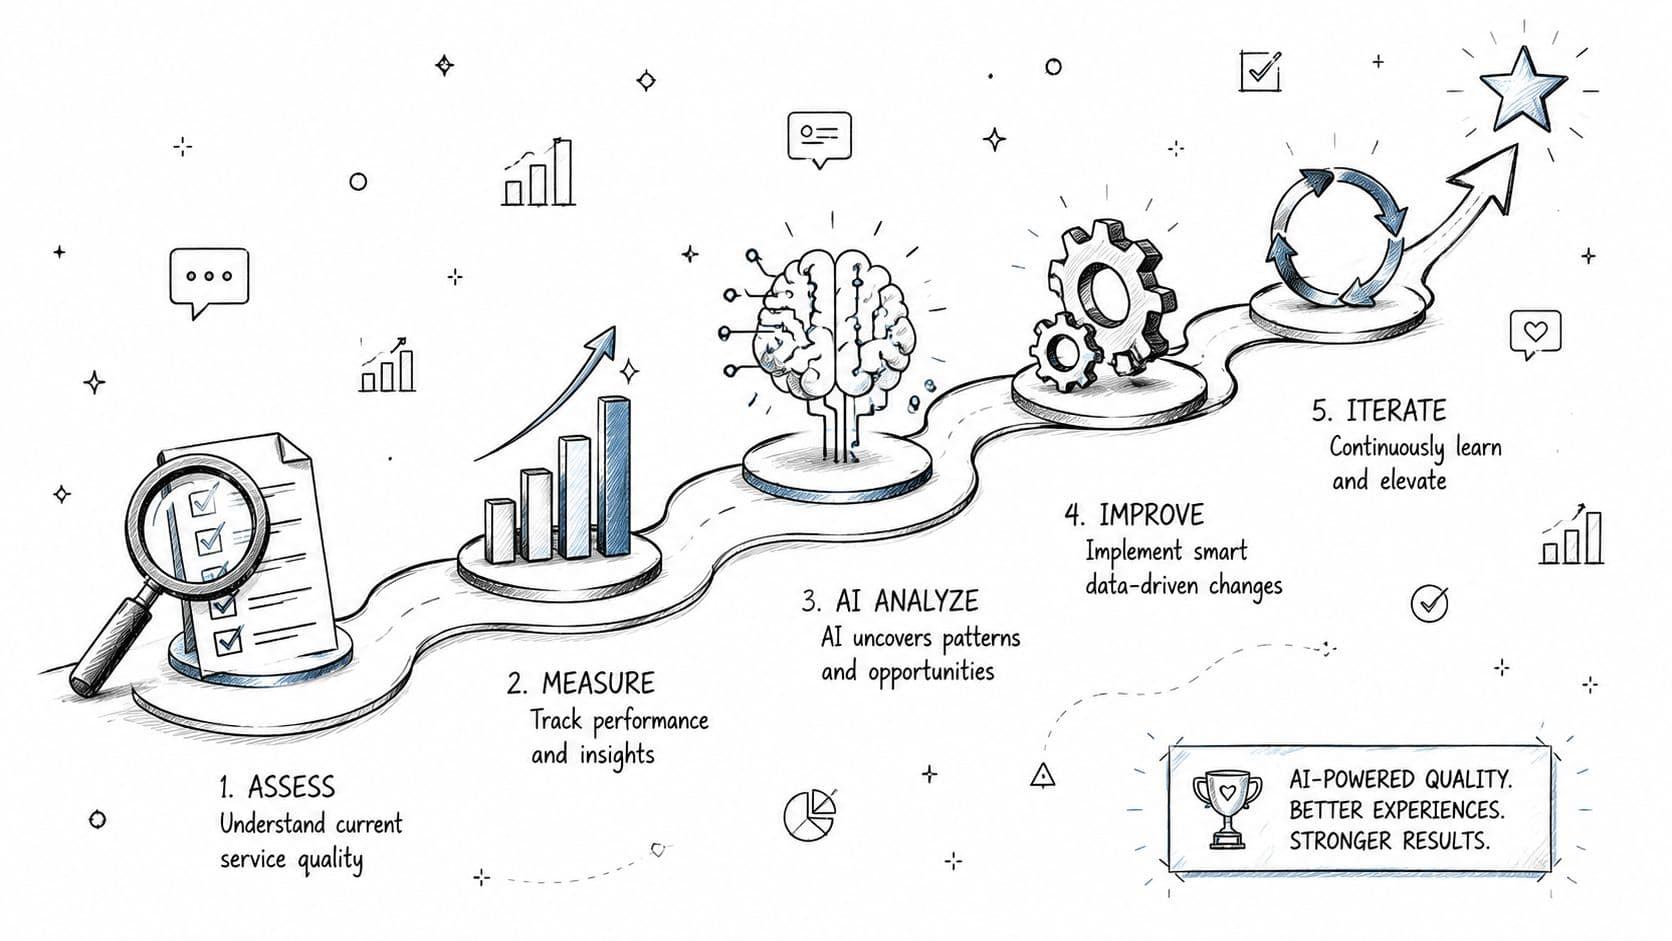
O trabalho de melhoria falha quando equipas tentam implementar uma correção antes de a terem provado. O padrão mais inteligente é um ciclo primeiro-piloto. Defina o defeito, meça o estado atual, analise a causa raiz, teste uma mudança estreita, depois bloqueie o ganho no trabalho padrão se se mantiver.
Use o ciclo da forma como as equipas de qualidade eram destinadas a usar
As disciplinas clássicas DMAIC e PDSA ainda se mantêm porque forçam clareza. Defina o CTQ ou defeito em linguagem simples. Meça a baseline atual com rendimento de processo, DPMO ou métricas de capacidade onde essas se ajustarem. Analise causas raiz em vez de discutir sobre anedotas. Depois execute um pequeno ciclo PDSA antes de implementação completa.
Os programas de serviço frequentemente quebram na etapa de medição. Um esforço de melhoria forte começa com baseline de desempenho atual, definição de CTQ e escolha de método de medição, depois usa matrizes de decisão e verificações de risco para escolher a melhor correção. A orientação do NHS sobre gestão de mudança com IA alinha-se com o mesmo padrão de forma prática, porque testes em pequena escala são como ganha compromisso antes de escalar.
Piloto antes de prometer
Um piloto de consultoria deve ter um objetivo escrito, um escopo definido e critérios de go-stop. Por exemplo, uma equipa de suporte poderia executar um piloto de staffing preditivo de quatro semanas para uma fila, com um objetivo quantitativo pré-registado para tempo de primeira resposta e um plano claro do que acontece se o modelo de previsão não melhorar a fila. Isto parece básico, mas evita uma armadilha comum.
Numa revisão de 120 projetos de melhoria de qualidade, 98% reportaram melhoria, mas apenas 27% atingiram um objetivo quantitativo pré-especificado, de acordo com a orientação de processo de serviço citada na literatura técnica. A explicação é simples. Muitas equipas nunca escreveram um objetivo adequado, então podiam celebrar movimento sem provar consecução de objetivo.
Regra de Piloto: sem objetivo escrito, sem piloto. Sem baseline, sem implementação. Sem critérios de go-stop, sem credibilidade.
Use uma matriz de decisão para comparar opções, escolha o teste mais pequeno possível e defina quem possui os dados do piloto. Se a mudança funciona, integre-a no trabalho padrão e num plano de controlo. Se não, pare limpar e aprenda rapidamente. É assim que a melhoria da qualidade do serviço evita tornar-se experimentação permanente sem ganho operacional.
Gestão de Mudança e Medição Sensível à Equidade
Muitos programas de qualidade não falham porque a análise estava errada. Falham porque o modelo operacional à volta da análise era fraco. As pessoas nunca foram alinhadas, os gestores não reforçaram a mudança e o novo processo morreu no momento em que a equipa de projeto saiu.
Construir a camada de hábito primeiro
Patrocínio multifuncional importa porque qualidade de serviço corta entre serviço, entrega, dados e equipas de conta. Apoio da gestão de topo, propriedade partilhada e monitorização sustentada são o que mantém melhorias de desaparecer. A evidência da indústria de serviço é direta sobre isto, falha corporativa de Six Sigma está frequentemente ligada a liderança fraca e controlo, enquanto programas bem-governados têm maior probabilidade de produzir ganhos duradouros. Não precisa de um comité de direção cerimonial. Precisa de uma cadência.
Um modelo de governança prático é simples. Execute revisões operacionais semanais para problemas ativos, revisões executivas mensais para desvio de KPI e recalibração trimestral de objetivos, escopo e propriedade. Isto mantém o trabalho vivo e evita o padrão comum onde uma reunião de lançamento recebe mais atenção do que a revisão operacional.
Meça quem se beneficia, não apenas se a média se moveu
O problema de equidade é fácil de perder porque médias parecem lisonjeiras. Um programa de serviço pode melhorar em geral e ainda deixar clientes mal servidos para trás. Uma revisão recente sobre melhoria de qualidade e desigualdades argumenta que projetos frequentemente falham em desagregar dados por desvantagem, depois chamam melhoria média uma vitória. Isto é o padrão errado.
Desagregue por segmento de cliente, região, língua ou canal. Se melhorias aglomeram entre clientes já bem servidos, o painel deve dizê-lo. A mesma revisão também empurra escolhas práticas que conteúdo de serviço genérico frequentemente ignora, como adaptar métodos de engajamento, locais, suporte de língua e loops de feedback para preferência comunitária. Isto importa mesmo em ambientes de serviço comercial, porque o mesmo viés operacional aparece sempre que equipas otimizam para as contas mais altas ou mais fáceis de servir.
A mentalidade correta é simples. Equidade não é um projeto paralelo. É uma escolha de design em medição, governança e entrega. Quando equipas de consultoria de IA ajudam clientes a construir esta camada, não estão a adicionar burocracia. Estão a certificar que melhoria de qualidade de serviço não alarga o fosso enquanto reclama sucesso.
O Seu Plano de Iniciação de Melhoria de Qualidade de Serviço em 90 Dias
Semanas 1 e 2, ligue o sistema de diagnóstico. Configure inquéritos transacionais, admissão de queixa, verificações de pulso de colaborador e um modelo de tema NLP para texto aberto. Semanas 3 e 4, defina a árvore de KPI e escreva um objetivo quantitativo pré-registado, não um objetivo vago. Semanas 5 a 8, execute um piloto de IA ou automação com critérios go-stop claros. Semanas 9 a 12, instale governança, verifique desempenho ao nível de segmento e decida se escala, revisa ou para.
Mantenha a checklist curta. Precisa de um patrocinador, um objetivo escrito, uma baseline, um piloto e um plano de controlo. Sem essas cinco coisas, o programa vai navegar para painéis e opiniões.
Os modos de falha comuns são previsíveis. Objetivos vagos, sem patrocinador, sem porta de piloto, e a crença de que IA é a estratégia em vez da alavanca. Salte esses erros e a melhoria da qualidade do serviço torna-se a disciplina operacional que faz investimentos em IA e automação compostos, especialmente em empresas de consultoria de IA e dados onde o próprio serviço é o produto.
A NILG.AI ajuda equipas a transformar a melhoria da qualidade do serviço num sistema operacional, não num deck de diapositivos. Se está a tentar conectar estratégia de IA, automação, análise preditiva e redesenho de processo a resultados de serviço reais, visite NILG.AI e use este tópico como briefing para a sua próxima sessão de trabalho.