In Artificial Intelligence, it is important to measure the quality of the data we are trying to use.
For instance, if we want to classify a cervix image according to the degree of cancer, how do we know if that image follows the acquisition protocol and can be used for diagnosing the patient [1] so that we can trust our prediction? In another domain, if we want to classify the topic of a given text (which may be written in colloquial language), how do you know if the text is useful/has good quality?
In Machine Learning, there’s a common saying that Garbage-in Garbage-out. Models are as good as the data they consume
Image quality estimation is a tough problem since quality is dependent on the user and the task itself. This is of special interest when we measure quality according to several factors and use it to make decisions (e.g., efficiency, durability, price of something).
We have previously faced the issue of objective quality estimation in several areas (image/text) and industries (TelCo, healthcare). In this blog post, we will discuss some alternatives from the Data Science community, as well as a methodology we have successfully used in the past to estimate data quality without supervision on the quality task.
What’s out there?
Quality Assessment research’s goal, up until now, has been to make quality predictions that are in agreement with the opinion of human observers. Quality measurement is typically done using very subjective labels – something of good quality to an observer can be of bad quality to another.
For instance, in [2], Convolutional Neural Networks are used for predicting subjective image quality in databases such as the LIVE Image Quality Assessment Database, using human-assessed quality labels.
Some unsupervised approaches [3] also group image quality metrics into several groups, such as compression artifacts, image noise, color artifacts, blur, and distortions. However, these approaches focus on a “technical” view of quality (signal quality) instead of a semantic/human perception. In the text domain [4], a set of automatic rules is defined for Software Documentation Quality which is mostly based on human readability and ease of implementation.
All these previously mentioned approaches have been applied with some success, but most focus on quantifying data acquisition errors. In some domains, such as the medical domain, it is important to have semantic knowledge of quality. As an example, in retinal fundus images, a common metric is the Image Structure Clustering (ISC). ISC assesses a correct distribution of pixel intensities corresponding to the relevant anatomical structures present in the retina [5].
However, creating such metrics and having them accepted by the researchers’ community is not feasible for each area, with lots of domain-specific rules. Besides, most methods for quality measurement are focused on a specific modality: images.
In this blog post, we propose a way to objectively measure the quality of any modality (image, text, tabular data), for both classification and regression problems and give a few use cases in which we can use this.
General Methodology
Let’s suppose we are trying to classify a given sample (e.g. an image or a document), and we want to objectively measure the quality of that sample.
We can consider that a good quality sample is the one reaches high scores in a secondary target task (e.g., classifying samples’ class, properly estimating a regression value, segmenting the image, etc.).
We have some semantic knowledge of quality for a given domain by modeling quality as task-specific, but that is generalizable for any problem.
For instance, in Customer Service, we can measure how informative a client’s technical issue description is to understand what happened with the client or to understand how close he is to churn (leaving the service). For medical images, we can measure how good an image is for classifying a certain form of cancer (which can depend on illumination conditions, domain-specific artifacts, etc.).
The first step has a model that can estimate the probability of that sample belonging to a certain class (discriminative model) or a regression model that estimates a continuous output.
We can then calculate the error associated with that estimation with the metric of interest. For instance, as in a classification task or by the absolute error/squared error in a regression task. We can have an error associated with each instance by saving the out-of-fold predictions.
We then need a second model that tries to predict the error using the sample as an input to automatically estimate sample quality.
Samples with higher error as an output of the second model will have lower quality, and therefore be more prone to having worse performance as an output of the first model.
Image Quality in Fashion-MNIST
Fashion-MNIST is a dataset of 60k 28×28 grayscale images of 10 fashion categories, along with a test set of 10,000 images, available in Keras’ datasets. We chose two classes to illustrate our approach for quality estimation (T-shirt/top vs trousers). How can we estimate the quality of this binary classification problem?
Initially, both train and test splits were concatenated, as we intend to calculate out-of-fold errors.
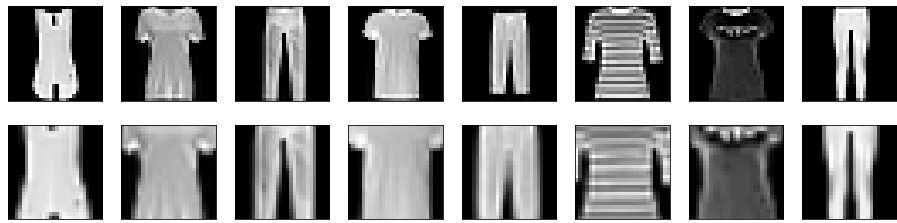
For simplicity, we introduced random zoom-in with a scale factor that can be manipulated to simulate the aggressiveness of our approach (in this case, a range of 0.5-0.9 was used from Keras’ ImageDataGenerator). The higher the scale factor, the more disrupted the image can be. With too low-scale factors, the image might not have changed at all. On the other hand, if the scale factor is too high, the images lose their meaning. However, you don’t need to apply data augmentation in a real-life setting. Instead, you can simply use your original images with quality variations as input.
Below, 8 images were randomly chosen before and after adding noise.
Model 1: Classifying samples
We used a standard VGG-like CNN for classifying the samples.
The out-of-fold sample error was calculated using 5-Fold Cross-Validation.
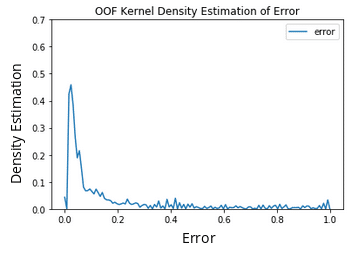
The next figure shows the Kernel Density Estimation of the model’s error. It can be seen that the model managed to obtain a low error on most of the samples since this is a binary classification problem that uses a relatively simple dataset, but there are some samples with high error.
Model 2: Estimating sample error
We attempted to create a model that could calculate sample error from the out-of-fold errors. The out-of-fold samples were randomly split into 30% test, and 70% train, and a similar architecture was applied, with a sigmoid activation and binary cross-entropy loss. MSE was not used as binary cross-entropy was found to have better convergence, and our output is between 0 and 1.
The Spearman Rank was 44%, showing that we can properly estimate the classification error and its monotonicity by having only an image.
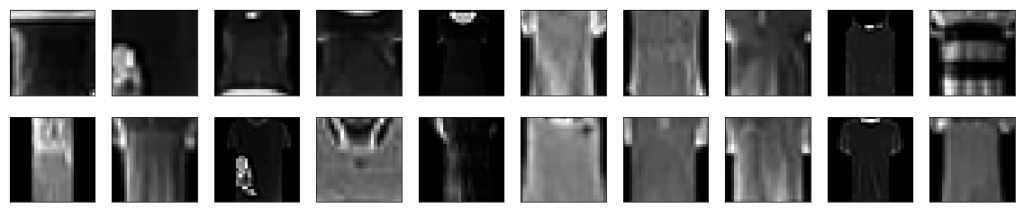
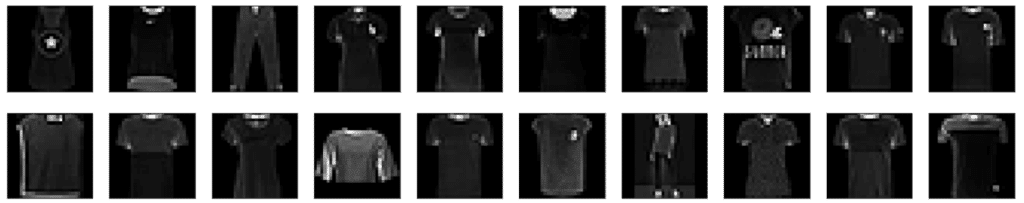
Below, the images the model considered to have the worst quality (highest estimated error) are shown.
It can be seen that these are images with bad acquisition conditions and with misleading shapes. Even the human eye has difficulty distinguishing both classes (top/trousers vs. pants) in some of the images.
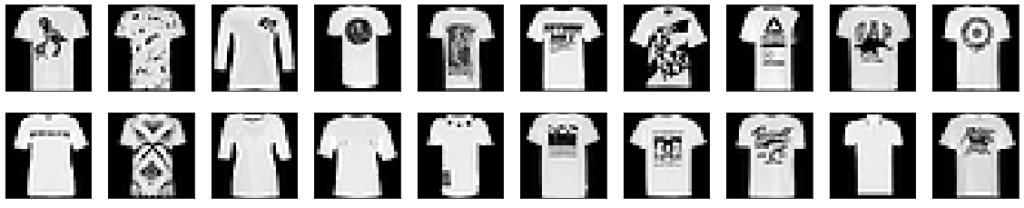
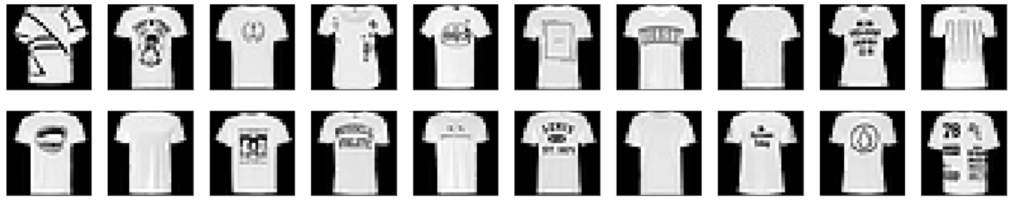
Next, the images the model considered to have the best quality (lowest estimated error) are shown. Note that since this is an unbalanced regression problem, most of the images will have low error and the example shown below is not fully representative of the whole “good quality” examples.
The higher quality images – t-shirts – are the ones that follow a standard “image acquisition protocol” and follow overall image patterns.
We then performed another experiment by removing the images with artificial data augmentation and re-training the whole process. In this new process, the images with the highest error are the following:
Once again, lower-quality images had similar behavior to the previous example. On the other hand, the images with lowest error are the following:
These images are also very similar to the ones presented below. The model managed to ignore the patterns of the t-shirts’ drawings and assumed the quality was good if the visible shape followed the “standards” of low-error images in the training set.
Discussion
We have created a domain-independent approach for estimating sample error in classification problems without relying on subjective human annotations.
In the literature, three approaches were previously shown: supervised, unsupervised and domain-specific. We can frame our approach as weakly supervised since we have a proxy of quality labels, and the errors on the task itself.
While the proposed approach has the main advantage of not requiring human labels, it has a few disadvantages. In some cases, we can have a low error, which can mislead the model into thinking that a bad image has high quality or vice-versa. Some cases in which this can occur are:
Low-quality class labels
Areas with low density (i.e., less frequent types of images) which the model wasn’t able to learn correctly
Cases that are difficult to learn and could have issues in the future (such as visually degraded images), but the model was good enough to discriminate them from the other class.
There are alternative approaches for measuring quality that are not described here.
Since this is not a generative model, we cannot fix the problem of possibly having high error in low-density areas with good quality data since we do not know if we are in such areas. We can either pair our current model with another generative model or think about a different architecture.
Using generative models, we can frame quality assessment as an anomaly detection problem. For instance, assuming the dataset has few bad-quality samples, we can learn its distribution. The lower the density of new samples, the worse their quality will be (or the more non-compliant).
Costa, P., Galdran, A., Meyer, M. I., Abràmoff, M. D., Niemeijer, M., Mendonça, A. M., & Campilho, A. (2017). Towards adversarial retinal image synthesis. arXiv preprint arXiv:1701.08974.
Gosta desta história?
Subscreva a Nossa Newsletter
Ofertas especiais, últimas notícias e conteúdo de qualidade na sua caixa de entrada.
Registar publicação única
Artigos recomendados
Article
Desbloqueie o Crescimento com a Previsão do Valor do Tempo de Vida do Cliente
13 de julho de 2026 in
Guia: Explicação
Desbloqueie crescimento real com a previsão do valor do tempo de vida do cliente. Aprenda modelos chave, necessidades de dados e roteiros de implementação para resultados estratégicos.
Estratégia de Transformação Empresarial: O Seu Guia para 2026
7 de julho de 2026 in
Guia: Explicação
Domine a sua estratégia de transformação empresarial com o nosso guia de 2026. Aprenda a executar roteiros de IA, evitar armadilhas e impulsionar o crescimento.
Um Guia Estratégico para IA Generativa para Transformação Empresarial
1 de julho de 2026 in
Guia: Explicação
Desbloqueie o crescimento real com o nosso guia de IA generativa para transformação empresarial. Aprenda a construir um roteiro, a encontrar casos de uso de alto valor e a medir o retorno do investimento em IA.
Utilizamos cookies no nosso website para lhe proporcionar a experiência mais relevante, lembrando as suas preferências e visitas repetidas. Ao clicar em “Aceitar Tudo”, concorda com a utilização de TODOS os cookies. No entanto, pode visitar as "Definições de Cookies" para fornecer um consentimento controlado.
Este website utiliza cookies para melhorar a sua experiência enquanto navega no website. Desses, os cookies categorizados como necessários são armazenados no seu navegador, pois são essenciais para o funcionamento das funcionalidades básicas do website. Também utilizamos cookies de terceiros que nos ajudam a analisar e compreender como utiliza este website. Estes cookies serão armazenados no seu navegador apenas com o seu consentimento. Tem também a opção de recusar estes cookies. No entanto, a recusa de alguns destes cookies pode afetar a sua experiência de navegação.
Os cookies necessários são absolutamente essenciais para que o website funcione corretamente. Estes cookies garantem funcionalidades básicas e recursos de segurança do website, de forma anónima.
Bolacha
Duração
Descrição
cookielawinfo-checkbox-analiticas
11 meses
Este cookie é definido pelo plugin de Consentimento de Cookies do RGPD. O cookie é usado para armazenar o consentimento do utilizador para os cookies na categoria "Análise".
---
O seu texto é uma etiqueta ou nome de campo, provavelmente de um sistema de gestão de cookies ou de um formulário web, e não uma frase completa que necessite de tradução contextual.
No entanto, se o objectivo for manter a clareza e a funcionalidade para um utilizador de língua portuguesa, sugiro a seguinte tradução e explicação:
**"Checkbox Funcional"**
**Explicação:**
* **Checkbox:** Refere-se ao elemento gráfico de marcação (uma caixa que pode ser seleccionada ou desmarcada).
* **Funcional:** Indica que esta caixa de seleção está relacionada com funcionalidades essenciais do website, como o login, a gestão do carrinho de compras ou outras características que tornam o site utilizável.
Se esta etiqueta pertencer a um contexto onde se refere especificamente a cookies, a tradução poderia ser ajustada para ter mais clareza:
**"Aceitação de Cookies Funcionais"**
ou
**"Cookies Essenciais (Funcionais)"**
Esta última opção é comum em avisos de cookies para indicar que estes são estritamente necessários para o funcionamento do site.
---
11 meses
O cookie é definido pelo consentimento de cookies GDPR para registar o consentimento do utilizador para os cookies na categoria "Funcional".
cookielawinfo-checkbox-necessary
11 meses
Este cookie é definido pelo plugin GDPR Cookie Consent. O cookie é usado para armazenar o consentimento do utilizador para os cookies na categoria "Necessário".
cookielawinfo-checkbox-outros
11 meses
Este cookie é definido pelo plugin GDPR Cookie Consent. O cookie é usado para armazenar o consentimento do utilizador para os cookies na categoria "Outros".
checkbox-performance-cookielawinfo
11 meses
Este cookie é definido pelo plugin GDPR Cookie Consent. O cookie é usado para armazenar o consentimento do utilizador para os cookies na categoria "Desempenho".
política_de_cookies_visualizada
11 meses
O cookie é definido pelo plugin GDPR Cookie Consent e é utilizado para armazenar se o utilizador consentiu ou não com a utilização de cookies. Não armazena quaisquer dados pessoais.
Os cookies funcionais ajudam a realizar certas funcionalidades como partilhar o conteúdo do website em plataformas de redes sociais, recolher feedback e outras funcionalidades de terceiros.
Os cookies de desempenho são usados para compreender e analisar os principais índices de desempenho do website, o que ajuda a proporcionar uma melhor experiência ao utilizador para os visitantes.
Os cookies analíticos são usados para entender como os visitantes interagem com o website. Estes cookies ajudam a fornecer informações sobre métricas como o número de visitantes, taxa de rejeição, fonte de tráfego, etc.
Os cookies de publicidade são usados para fornecer aos visitantes anúncios relevantes e campanhas de marketing. Estes cookies rastreiam os visitantes em diferentes websites e recolhem informações para fornecer anúncios personalizados.

 in a classification task or by the absolute error/squared error in a regression task. We can have an error associated with each instance by saving the out-of-fold predictions.