Computer Vision • Deep Learning • Information Retrieval • Recommender System •
An AI-Based Image Content Retrieval System
From unsupervised to supervised approaches
Maria Loureiro on Mar 7, 2021
?>
Similarity measurement is the basis for any information retrieval, management, or data mining system. Both in industry and in the scientific community, similarity detection has been shown to be extremely useful when applied to different use cases.
Over time, the information available on the internet has been growing in an exponential way, making it harder to analyze and consume without the help of information retrieval systems or filtering tools, with its core elements corresponding to the analysis of similarity between different text segments. Finding and filtering relevant information according to personal preferences is a time-consuming task in the daily effort to stay well-informed.
Moreover, similarity detection applied to images also has a great number of possible applications, in several fields. In biometric systems, particularly in signature and face recognition systems, image similarity detection is extremely relevant in cases of forgery detection and visual identification, respectively (1). In the shopping industry, it can also be of great importance to the detection of counterfeit products, by determining the similarity between a query image and a database of valid images (2), product recognition on store shelves (3) and content-based image retrieval (CBIR), enabling image-based queries in online stores (4).
Development of a CBIR System using a Clothing Dataset
Taking into consideration the growing demand for CBIR systems in online shopping and the evident growth of this way of e-commerce retail (5), during my internship in NILG.AI, I developed a demo of a CBIR system with a clothing dataset: the Apparel Images Dataset (6).
The chosen dataset is composed of 11 385 amateur photographs of clothing items (6), with a total of 6 different colors and 5 types of items. A total of 11 384 pairs of images, both positive and negative, were created from this dataset to then calculate image similarity. For these pairs, two distinct tasks were defined: clothing type and color. For each of these tasks, 5692 pairs were created, where half of them were positive and the other half negative. In other words, for the pairs with the task being clothing color, for example, half of the pairs were composed of clothes with similar color – positive pairs – and the other half with distinct colors – negative pairs.
As an example, two pairs – one positive and another negative – assigned with the task of clothing type are presented below.
To detect the similarity between two images, different techniques can be applied, from classical similarity measurements, using distance metrics, to trained machine learning models. Regardless of the chosen approach, the feature vector of each image – extracted from pre-trained deep learning models – can be used as data to compute the similarity.
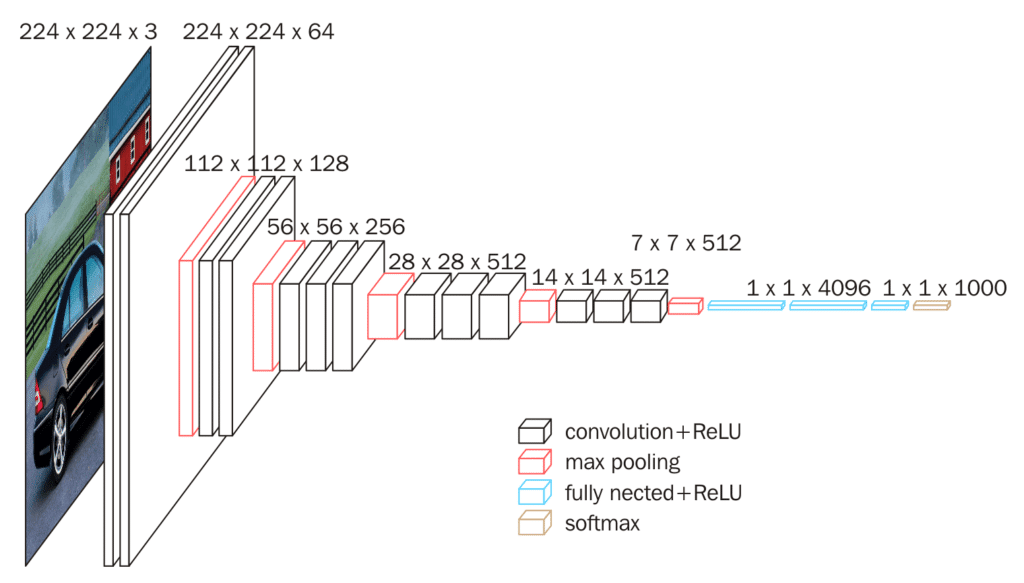
For the extraction of the feature vector of each image, a pre-trained model was used: the VGG16 convolutional neural network, where the last layer was removed to obtain the feature vector (7).
Regarding similarity computation, Euclidean Distance is a simple but powerful measurement technique that can be applied to two feature vectors extracted from a pair of images. Another alternative is the Cosine Distance, that computes the difference in direction, irrespective of the length of each feature vector, where the distance is given by the angle between the two vectors (8). Both metrics were chosen to integrate the work developed.
Regarding machine learning models, there are also several possible options that can be used in this type of similarity measurement. Logistic Regression and Random Forest are two widely used models, having a great variety of applications, and both were selected as similarity detection techniques, using the extracted feature vector for training the model. For Logistic Regression in particular, feature normalization was also included in the pipeline since it benefited the classification results.
The four approaches were evaluated with respect to Pearson and Spearman coefficients between the similarity value given by each technique and the target classification of each pair of images. The results can be seen in the table below.
Method
Pearson
Spearman
Cosine Similarity
0.387
0.358
Inverse Euclidean Distance
0.298
0.276
Logistic Regression
0.721
0.719
Random Forest
0.696
0.705
Although better results were clearly achieved by machine learning models in comparison to similarity metrics, as expected, all tested approaches were included in the final demo.
For the front-end of the demo, Streamlit – an open-source python library – was used, which helped to easily create an interactive application for the system developed. Moreover, the application was deployed using Docker, to create a reproducible environment and facilitate its use in different machines.
The developed application, like previously mentioned, retrieves the most similar images in the dataset, when compared to the image in analysis. The latter can be chosen by the user and uploaded on the website or can be randomly selected by the algorithm, within the images available in the dataset. Moreover, the application also enables the user to choose one of the previously mentioned approaches to compute the similarity detection.
Some examples of the developed system are presented below.
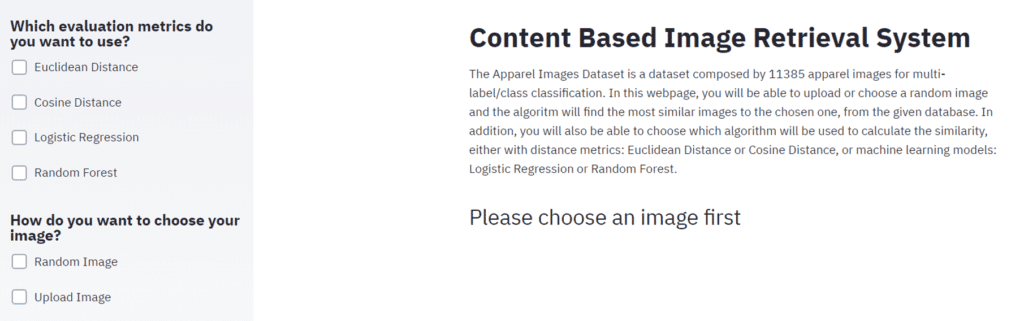
Application Initial Page
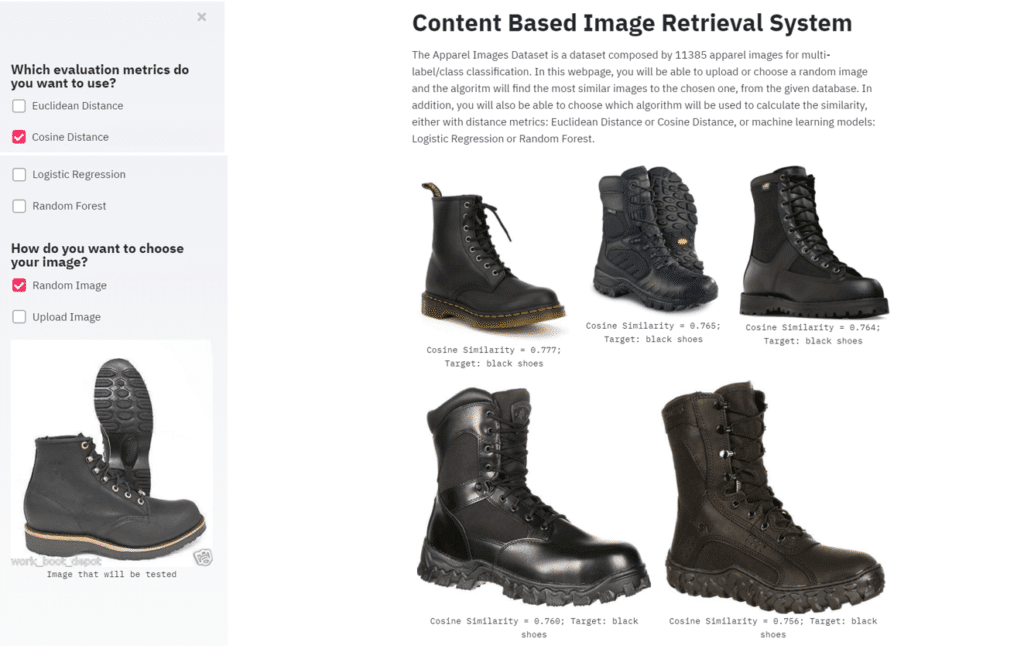
Example with the use of Euclidean Distance as the similarity measure and test with a random image from the dataset:
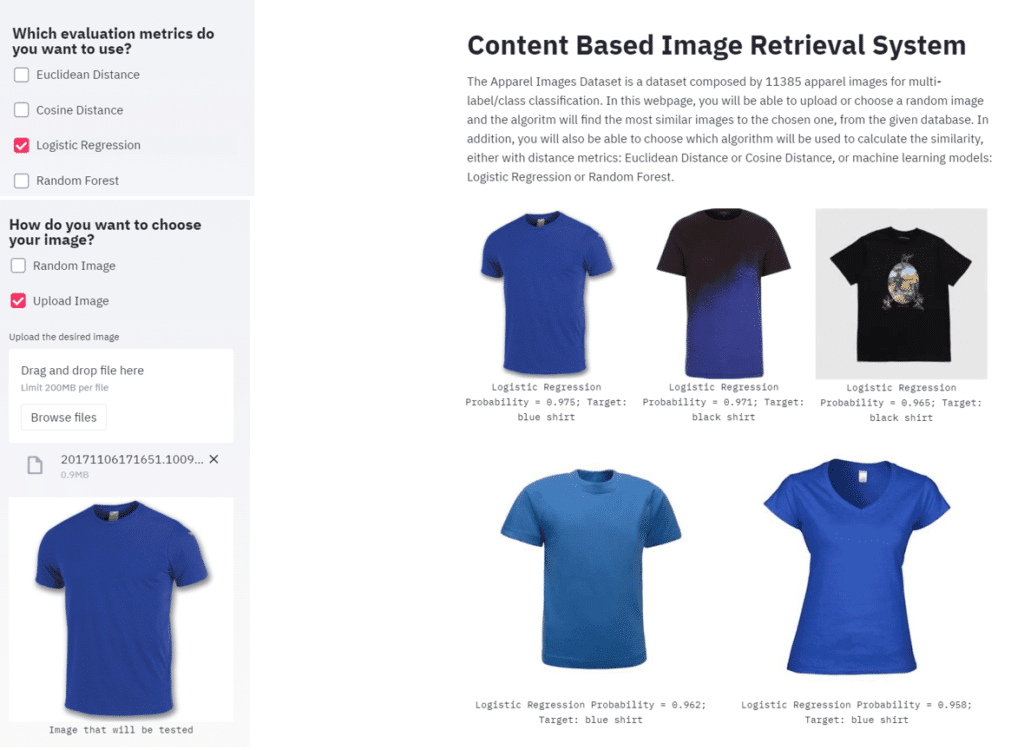
Example with the use of a pre-trained Logistic Regression model as the similarity measure and test with an image uploaded which is not included in the dataset:
Final Remarks
As previously mentioned, there is a great number of use cases regarding image similarity detection, showing its growth potential over the next few years. The live demo here explained, and developed for a content-based image retrieval system, is just a small example of the possibilities in this area. Hope that this post inspires you to develop new projects by yourself or with the help of the NILG.AI team!
Transform Your Growth with custom ai software development in 2026
Apr 1, 2026 in
Guide: Explainer
Explore how custom ai software development can boost efficiency, cut costs, and deliver measurable value - find trusted partners and practical steps for 2026.
Discover how AI for customer service can transform your support operations. Learn practical strategies to reduce costs, improve satisfaction, and drive growth.
We use cookies on our website to give you the most relevant experience by remembering your preferences and repeat visits. By clicking “Accept All”, you consent to the use of ALL the cookies. However, you may visit "Cookie Settings" to provide a controlled consent.
This website uses cookies to improve your experience while you navigate through the website. Out of these, the cookies that are categorized as necessary are stored on your browser as they are essential for the working of basic functionalities of the website. We also use third-party cookies that help us analyze and understand how you use this website. These cookies will be stored in your browser only with your consent. You also have the option to opt-out of these cookies. But opting out of some of these cookies may affect your browsing experience.
Necessary cookies are absolutely essential for the website to function properly. These cookies ensure basic functionalities and security features of the website, anonymously.
Cookie
Duration
Description
cookielawinfo-checkbox-analytics
11 months
This cookie is set by GDPR Cookie Consent plugin. The cookie is used to store the user consent for the cookies in the category "Analytics".
cookielawinfo-checkbox-functional
11 months
The cookie is set by GDPR cookie consent to record the user consent for the cookies in the category "Functional".
cookielawinfo-checkbox-necessary
11 months
This cookie is set by GDPR Cookie Consent plugin. The cookies is used to store the user consent for the cookies in the category "Necessary".
cookielawinfo-checkbox-others
11 months
This cookie is set by GDPR Cookie Consent plugin. The cookie is used to store the user consent for the cookies in the category "Other.
cookielawinfo-checkbox-performance
11 months
This cookie is set by GDPR Cookie Consent plugin. The cookie is used to store the user consent for the cookies in the category "Performance".
viewed_cookie_policy
11 months
The cookie is set by the GDPR Cookie Consent plugin and is used to store whether or not user has consented to the use of cookies. It does not store any personal data.
Functional cookies help to perform certain functionalities like sharing the content of the website on social media platforms, collect feedbacks, and other third-party features.
Performance cookies are used to understand and analyze the key performance indexes of the website which helps in delivering a better user experience for the visitors.
Analytical cookies are used to understand how visitors interact with the website. These cookies help provide information on metrics the number of visitors, bounce rate, traffic source, etc.
Advertisement cookies are used to provide visitors with relevant ads and marketing campaigns. These cookies track visitors across websites and collect information to provide customized ads.