This article describes the key points of my participation at the 2021 Edition of the World Data League. The Tech Moguls Team, composed of me, Tiago Gonçalves, Tomé Albuquerque and Joana Morgado, from INESC TEC, finished second place in this edition.
World Data League (WDL) is a Data Science competition where groups of Data Scientists work to solve social problems using data. There were several main topics – Public Transportation, Traffic, Cycling, Environment. Each one was broken down into 4 smaller sub-topics, originating a two weeks Stage per sub-topic.
The finals were a 3-day event with the top-10 finalists, about Noise Pollution. All the code, data and challenge descriptions are available on the official WDL gitlab. For more detail than the provided here, please see the notebooks linked below.
The way we think about problem-solving at NILG.AI allowed me to participate in this challenge. The whole Lean Data Science pipeline – creating a baseline solution, thinking about how the end user could use it, and calculating business metrics besides technical metrics – is very relevant when developing solutions that generate value. In this article, we show our way of reasoning.
Stage 1 – Public Transportation
In this stage, we covered churn models in public transportation. The dataset contained two periods of time (including the COVID-19 lockdown periods in Portugal) with the average number of bus users per day aggregated per different locations, gender, and age groups. The goal was to identify churn profiles and propose measures to reduce them.
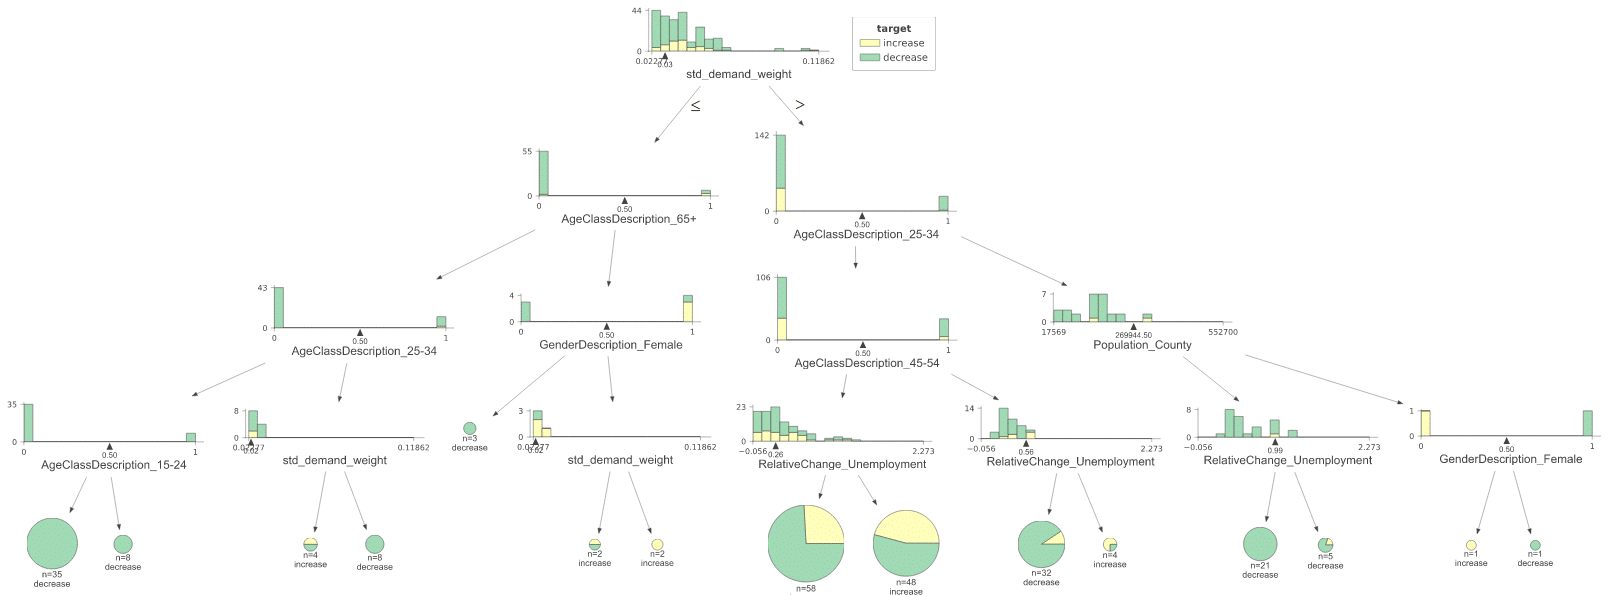
For this, we used a Decision Tree to predict the probability of a certain segment increasing or decreasing the usage of public transportations, throughout the two periods given, with variables we considered to be relevant, in order to create groups that could be used to explain churn. The tree’s branches would give us information about the segments and their size.
We discovered two segments with a high propensity for churning:
Our first segment refers to users from the South of Portugal, whose ages are not in 65+ nor 25-34
Our second segment refers to users from 25-34 a little bit all over the country
The most relevant variables that explained this decrease were:
Population Density in the County and District
Relative Change in Unemployment
Variability in demand, extracted from the Origin-Destination matrix, which can be a proxy for the easiness of flow going out of a county into the parishes
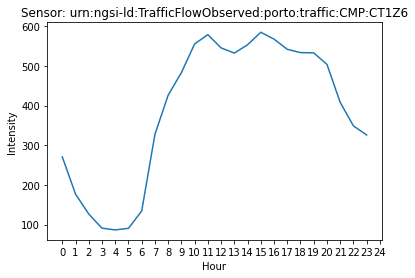
The plot below shows a typical example of the average traffic flow in the city of Porto: it decreases during the night, and starts to increase around 04:00/05:00, which marks the time-points when people start their working routine. It then keeps increasing until 10:00/11:00 and has an approximately stable behaviour until the end of the working hours, 18:00/19:00, starting to decrease afterwards.
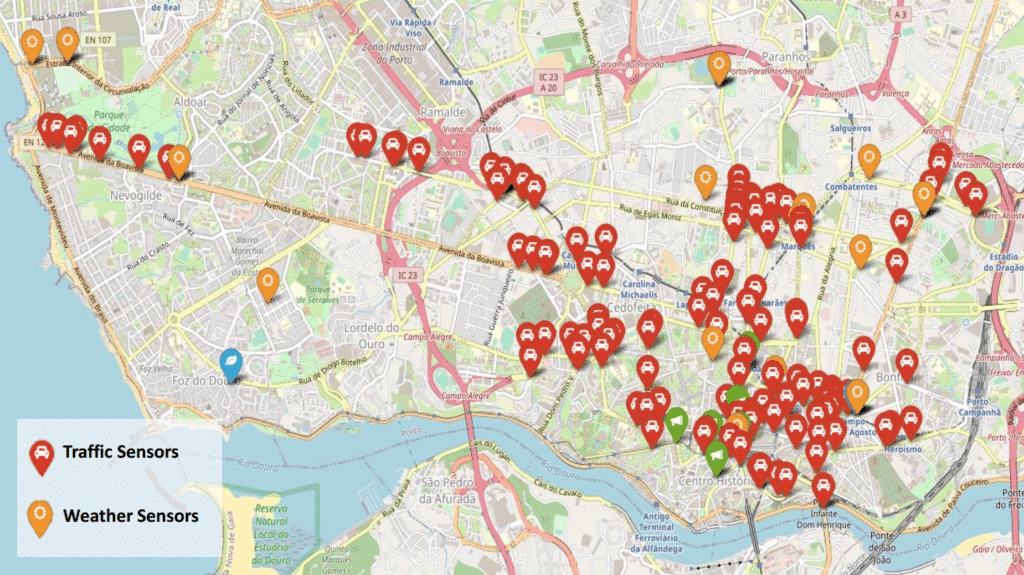
Our solution focused on forecasting traffic for 24h hours later for the city of Porto. We used an XGBoost Classifier with weather features (current and forecast), historical intensity features (e.g. average intensity in the past), date features (whether it’s a holiday/weekend at prediction time, hour, week day, …) and sensor position features (distance to sensor centroid).
This could be used, for instance, for dynamically changing traffic light frequency depending on the area and time of the day.
This stage had another outcome – the acceptance of a paper for SoGood 2021 – The 6th Workshop on Data Science for Social Good (Paulo Maia, Joana Morgado, Tiago Gonçalves and Tomé Albuquerque – Applying Machine Learning for Traffic Forecasting in Porto, Portugal)!
Stage 3 – Cycling
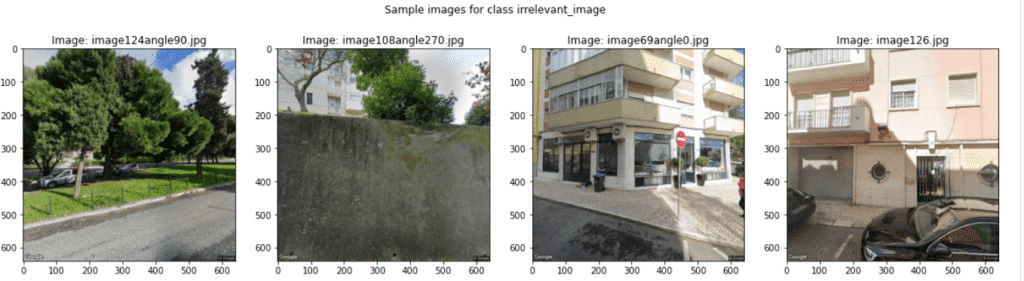
In the third stage, we worked on (Literally) paving the way towards safer cities. In this challenge, we had access to Google Street Maps images in Lisbon, in four different angles (0 – 360º) and the goal was to estimate a score of perceived road safety based on objects in an image.
We labeled a subset of images with the following classes:
Irrelevant view: whenever the street is fully visible or the image is just pointing to a wall;
Street width: a single car could fit the street vs more than one car could fit there;
Pavement Type: parallels (paralelo), tar (alcatrão) or dirt (terra batida);
Pavement quality (low, high, or mid);
A pre-trained model for car detection was also used to count the amount of cars in each image. This could allow us to obtain traffic intensity as a proxy for danger.
As an example, here’s a subset of images that were labeled as irrelevant:
Afterwards, we associated a risk score with the presence of each of these, and averaged the score for each angle – which could be used for creating a street-level risk map.
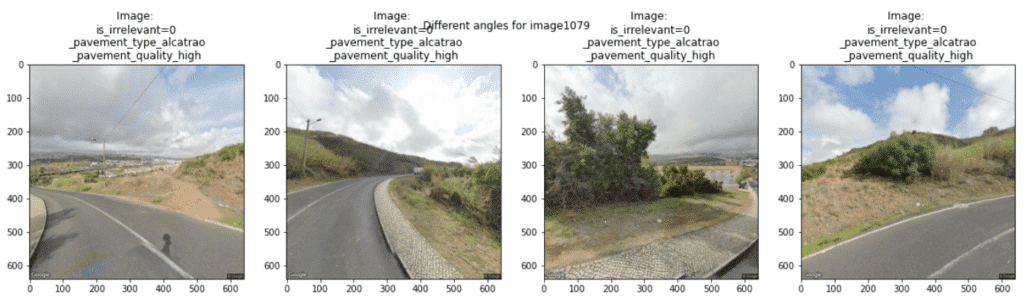
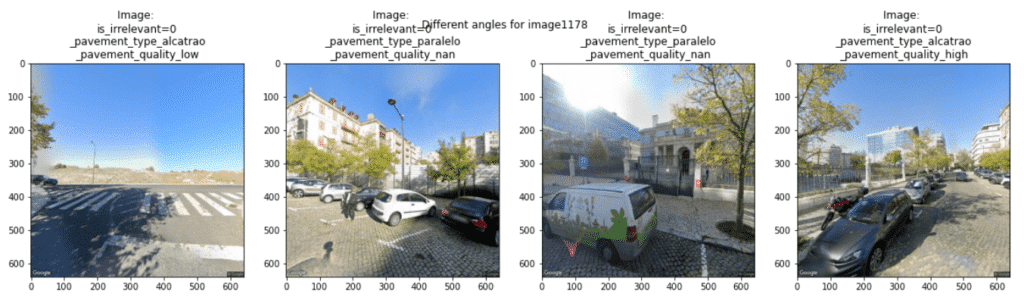
The groups of 4 images below show low risk and high risk scores, respectively, based on our established rules.
Images with the bottom risk scores are images with pavement type “alcatrao”/tar, where the pavement quality is high (no visible cracks), and there are no cars present.
Images with the top risk scores are images with pavement type “paralelo”, where cars appear.
Stage 4 – Environment
For the fourth stage, we worked on Optimisation of outdoor advertisements in cities. Cities are flooded by countless outdoor advertising panels, often with a poor distribution”. Visual aspects are crucial in the urban planning process since each plan choice can generate obstruction of urban elements, thus producing adverse effects on the city’s image.
The dataset contained the coordinates of several billboards, as well as the average number of visitors.
Our approach considered that we could only add or remove billboards from a location, but had to replace them in another existing location, as we do not know which coordinates are valid locations for billboards.
We developed a metaheuristics-based algorithm (local/neighborhood search) that optimizes the outdoor-billboard density (reducing it) and the total number of views (i.e., the number of outdoor billboards in a given radius – increasing it). We start by creating neighbor solutions through swap operations in which we change the coordinates of a given billboard and assess the impact on our fitness function, which takes this variable into account.
The provided data was about noise sensors in the city of Torino, Italy, as well as points of interest and police complaints.
We developed an explainable XGBoost Classifier capable of predicting the probability of noise levels exceeding the legal limit for the next day (at the same time) in the neighbourhood. A model was used to predict the volume of complaints. Finally, both models were combined into an expected annoyance value: the probability of noise exceeding the threshold level AND causing annoyance (according to tabulated values in the literature) AND causing a complaint. This makes the decision very actionable as it combines reasoning for negative consequences.
The users of this solution could be the local police forces who, knowing that in a given area the next day the probability of the noise level exceeding the limit is high, can optimise patrols and organise the teams. This model, by presenting the possible cause of the probability being high, allows the police to know in advance what to expect on the spot.
Conclusion
This article described my participation in the 2021 WDL competition – there’s now an insights report available with a summary of all the project outcomes you can check out.
Like this story?
Subscribe to Our Newsletter
Special offers, latest news and quality content in your inbox.
Signup single post
Recommended Articles
Article
Unlock Ai First Meaning: Strategic Guide for 2026
Jun 22, 2026 in
Guide: Explainer
Unlock the true ai first meaning for your business. Get a 2026 strategic roadmap, practical examples, and avoid common pitfalls.
AI for Business Growth Your Practical Strategy Guide
Jun 17, 2026 in
Guide: Explainer
Discover how AI for business growth can boost efficiency, improve decision-making, and create deeper customer connections. Get actionable strategies now.
We use cookies on our website to give you the most relevant experience by remembering your preferences and repeat visits. By clicking “Accept All”, you consent to the use of ALL the cookies. However, you may visit "Cookie Settings" to provide a controlled consent.
This website uses cookies to improve your experience while you navigate through the website. Out of these, the cookies that are categorized as necessary are stored on your browser as they are essential for the working of basic functionalities of the website. We also use third-party cookies that help us analyze and understand how you use this website. These cookies will be stored in your browser only with your consent. You also have the option to opt-out of these cookies. But opting out of some of these cookies may affect your browsing experience.
Necessary cookies are absolutely essential for the website to function properly. These cookies ensure basic functionalities and security features of the website, anonymously.
Cookie
Duration
Description
cookielawinfo-checkbox-analytics
11 months
This cookie is set by GDPR Cookie Consent plugin. The cookie is used to store the user consent for the cookies in the category "Analytics".
cookielawinfo-checkbox-functional
11 months
The cookie is set by GDPR cookie consent to record the user consent for the cookies in the category "Functional".
cookielawinfo-checkbox-necessary
11 months
This cookie is set by GDPR Cookie Consent plugin. The cookies is used to store the user consent for the cookies in the category "Necessary".
cookielawinfo-checkbox-others
11 months
This cookie is set by GDPR Cookie Consent plugin. The cookie is used to store the user consent for the cookies in the category "Other.
cookielawinfo-checkbox-performance
11 months
This cookie is set by GDPR Cookie Consent plugin. The cookie is used to store the user consent for the cookies in the category "Performance".
viewed_cookie_policy
11 months
The cookie is set by the GDPR Cookie Consent plugin and is used to store whether or not user has consented to the use of cookies. It does not store any personal data.
Functional cookies help to perform certain functionalities like sharing the content of the website on social media platforms, collect feedbacks, and other third-party features.
Performance cookies are used to understand and analyze the key performance indexes of the website which helps in delivering a better user experience for the visitors.
Analytical cookies are used to understand how visitors interact with the website. These cookies help provide information on metrics the number of visitors, bounce rate, traffic source, etc.
Advertisement cookies are used to provide visitors with relevant ads and marketing campaigns. These cookies track visitors across websites and collect information to provide customized ads.