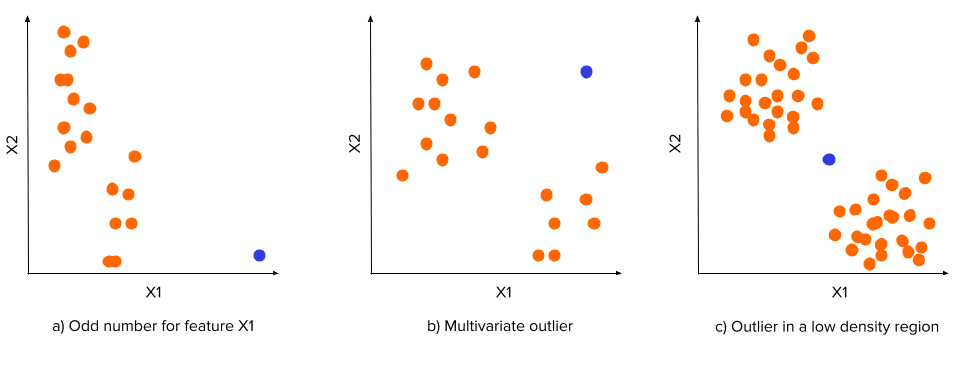
Outliers are data points that stand out for being different from the remaining data distribution. An outlier can be:
An odd value in a feature
A data point distant from the centroid of the data
A data point in a region of low density, but between areas of high density.
Suppose you have been working in data science. In that case, you are already familiar with the concept, and you have probably integrated different methods in your pipelines to detect, transform, or even remove outliers from your data.
If so, be careful! Outliers do not respect the data distribution, so you should not pretend they do by removing inconvenient data points or transforming their features to become closer to the remaining data distribution. I know you need to handle them to avoid nonsensical values disturbing your pipeline. Still, you can also let the model know those data points are outliers instead of ignoring that information. The two main questions here are: Why? and How?
Why? Because you never know the cause of an outlier. It can represent either an error in the data acquisition process or a real anomaly in your population. This is highly relevant when dealing with Fraud Detection, Predictive Maintenance, or Compliance Validation situations. In these use cases, you want to detect the odd values (outliers) to prevent further risks.
How? Creating new features that represent how odd a data point is. If you make this information clear to the model, it will be able to detect the outliers by itself. But if outliers can be of different forms (as seen in the figure above), what features can represent their oddness? Find the answer in the next section!
Features for Outliers
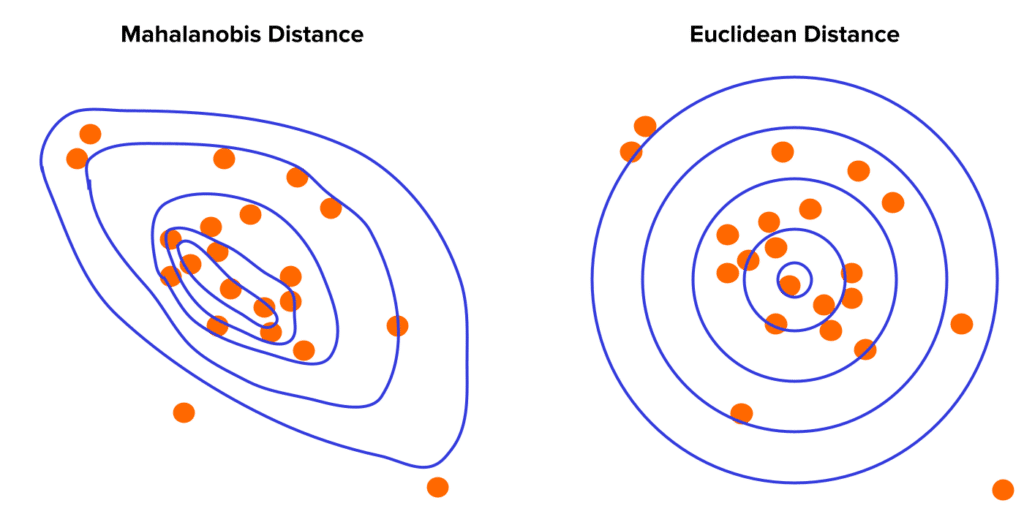
Mahalanobis Distance
You can use different distance algorithms to compute how far a data point is from the centroid. We recommend the Mahalanobis distance since it is better to deal with multivariate outliers resulting from unusual combinations between multiple variables. For example, consider these three variables: weight, height, and gender. A height of 150 cm is not that unusual for the Portuguese female population, and a weight of 90kg is not uncommon for the Portuguese male. However, a female Portuguese with 150 cm and 90 kg would be very unique.
Density Estimation
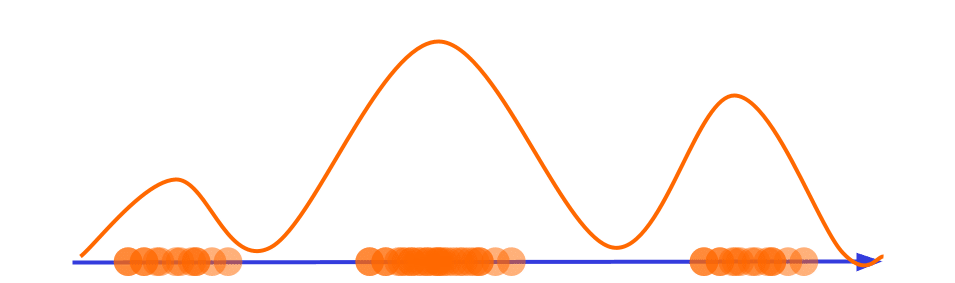
Previously we saw a feature that measures the distance to the centroid, but what if the data distribution has a shape like the one in the figure below?
In this case, an outlier can be a data point located in the regions where the density distribution has a depression, no matter the distance to the centroid. So a good feature to represent it would be the data density in the neighborhood of the data point.
You can use methods like KDE (Kernel Density Estimation) to estimate the density. However, this method can be too computationally expensive. So we propose a more straightforward and cheaper method: binning.
There are two ways of using binning to estimate density distribution:
Use bins with equal widths: Split the data into equal-width bins and compute the density of each bin. The fewer points the bin has, the more normal the data point is.
Use bins with equal frequencies: Split the data into equal-frequency bins and compute the width of the bin. The larger the bin, the more abnormal the data point is
Autoencoders Reconstruction
Training an autoencoder with your data will let the encoder learn the data distribution of the different variables and their relationship. Then, when the autoencoder receives a data point that deviates from the remaining data, it won’t be able to reconstruct the data point correctly.
A good feature to represent outliers would be the distance between the input, X, and the output, X’ (e.g., cosine distance). Higher distances will be correlated with odder data points.
Now that you know how to detect outliers, you have a new trick to detect possible frauds, anomalies, or errors without needing to collect data for all those exceptions. Here, we presented you with three different ways to do so.
For more ideas on how to get the most out of your data, subscribe to our newsletter below and stay tuned.
Like this story?
Subscribe to Our Newsletter
Special offers, latest news and quality content in your inbox.
Signup single post
Recommended Articles
Article
Transform Your Growth with custom ai software development in 2026
Apr 1, 2026 in
Guide: Explainer
Explore how custom ai software development can boost efficiency, cut costs, and deliver measurable value - find trusted partners and practical steps for 2026.
Discover how AI for customer service can transform your support operations. Learn practical strategies to reduce costs, improve satisfaction, and drive growth.
How Might We Statements: Turn Challenges into Opportunities
Mar 15, 2026 in
Guide: Explainer
Discover how might we statements transform complex challenges into real opportunities. Learn practical crafting tips, workshops, and real-world examples.
We use cookies on our website to give you the most relevant experience by remembering your preferences and repeat visits. By clicking “Accept All”, you consent to the use of ALL the cookies. However, you may visit "Cookie Settings" to provide a controlled consent.
This website uses cookies to improve your experience while you navigate through the website. Out of these, the cookies that are categorized as necessary are stored on your browser as they are essential for the working of basic functionalities of the website. We also use third-party cookies that help us analyze and understand how you use this website. These cookies will be stored in your browser only with your consent. You also have the option to opt-out of these cookies. But opting out of some of these cookies may affect your browsing experience.
Necessary cookies are absolutely essential for the website to function properly. These cookies ensure basic functionalities and security features of the website, anonymously.
Cookie
Duration
Description
cookielawinfo-checkbox-analytics
11 months
This cookie is set by GDPR Cookie Consent plugin. The cookie is used to store the user consent for the cookies in the category "Analytics".
cookielawinfo-checkbox-functional
11 months
The cookie is set by GDPR cookie consent to record the user consent for the cookies in the category "Functional".
cookielawinfo-checkbox-necessary
11 months
This cookie is set by GDPR Cookie Consent plugin. The cookies is used to store the user consent for the cookies in the category "Necessary".
cookielawinfo-checkbox-others
11 months
This cookie is set by GDPR Cookie Consent plugin. The cookie is used to store the user consent for the cookies in the category "Other.
cookielawinfo-checkbox-performance
11 months
This cookie is set by GDPR Cookie Consent plugin. The cookie is used to store the user consent for the cookies in the category "Performance".
viewed_cookie_policy
11 months
The cookie is set by the GDPR Cookie Consent plugin and is used to store whether or not user has consented to the use of cookies. It does not store any personal data.
Functional cookies help to perform certain functionalities like sharing the content of the website on social media platforms, collect feedbacks, and other third-party features.
Performance cookies are used to understand and analyze the key performance indexes of the website which helps in delivering a better user experience for the visitors.
Analytical cookies are used to understand how visitors interact with the website. These cookies help provide information on metrics the number of visitors, bounce rate, traffic source, etc.
Advertisement cookies are used to provide visitors with relevant ads and marketing campaigns. These cookies track visitors across websites and collect information to provide customized ads.

 Suppose you have been working in data science. In that case, you are already familiar with the concept, and you have probably integrated different methods in your pipelines to detect, transform, or even remove outliers from your data.