AI Automations • AI Strategy • AI4business • Artificial Intelligence •
Your Guide to Customer Retention Rate Calculation
NILG.AI on Feb 3, 2026
?>
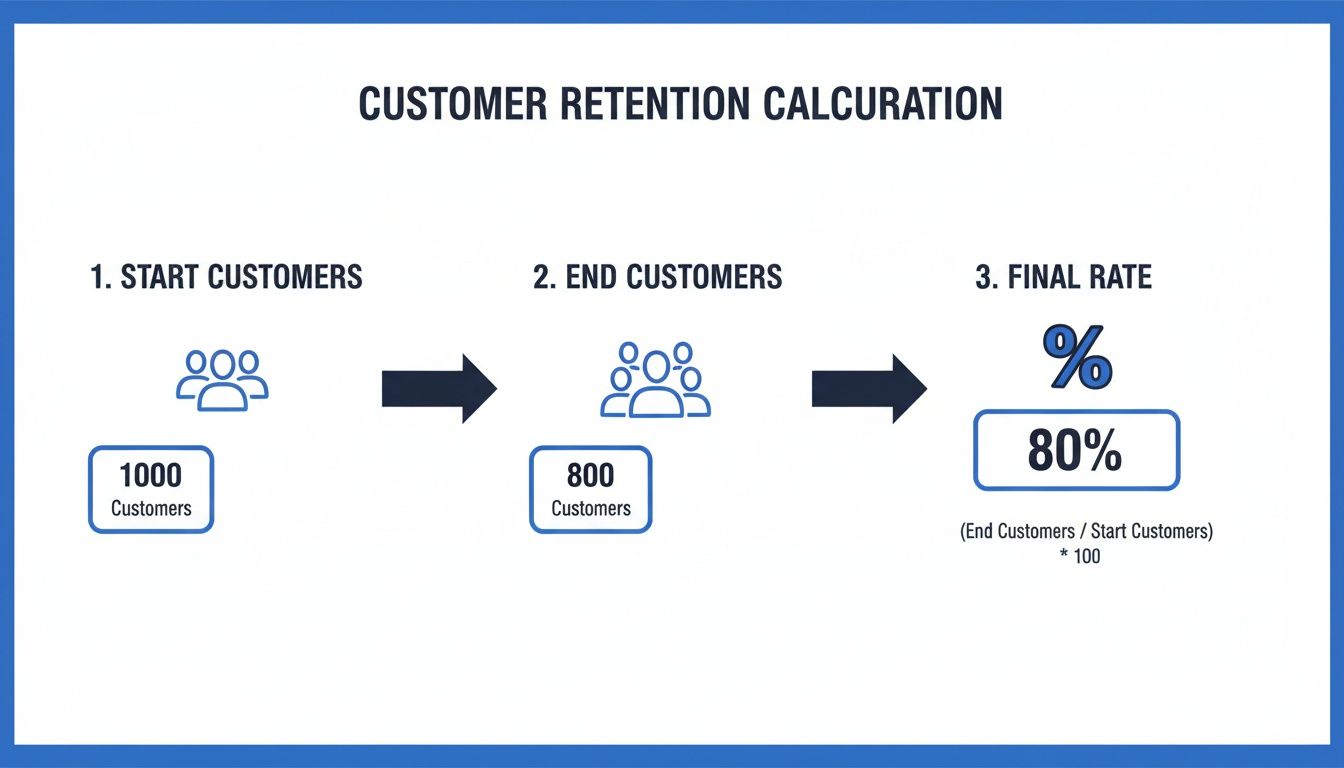
Understanding your customer retention rate is straightforward in principle. It's the percentage of customers you keep over a specific period. The standard formula involves taking your customer count at the end of a period, subtracting new customers acquired during that time, dividing by your starting customer count, and multiplying by 100 to get a percentage.
But don't let the simple math fool you. This single metric offers profound strategic insights into the health and long-term viability of your business.
Why Retention Rate Is Your Most Important Growth Metric
It’s easy to get caught up in the pursuit of new customers. While landing a new client is a victory, sustainable, long-term growth is built on retaining the clients you've already worked hard to win.
For businesses in the AI and data consulting space, calculating your customer retention rate isn't just an accounting exercise; it's a vital diagnostic tool for your entire operation.
Think of it as the ultimate feedback loop. A high retention rate is a clear signal that your services are delivering value, your client relationships are strong, and your business model is sound. Conversely, a declining rate is often the first red flag that a critical part of the customer journey—from onboarding to project delivery to ongoing support—needs immediate attention.
From Metric To Actionable Insight
Once you have a firm grasp on your retention numbers, you can begin making more strategic business decisions. It enables you to:
Forecast Revenue with Confidence: A stable retention rate creates a predictable revenue baseline, transforming financial planning from guesswork into a data-driven process.
Gauge Client Satisfaction: It's an unfiltered indicator of client happiness. When clients continue to invest in your services, it's the most powerful vote of confidence they can give.
Optimize Marketing Spend: Understanding why your best clients stay allows you to refine your marketing to attract more of those ideal, high-retention profiles from the outset.
Pinpoint Service Weaknesses: A sudden drop in retention can be a smoke signal, helping you identify and resolve friction points in project delivery, communication, or post-project support before they become systemic problems.
The real magic happens when you stop seeing retention rate as a backward-looking number and start using it to build a forward-looking strategy. It shifts your entire focus from the expensive, endless hunt for new leads to nurturing the valuable relationships you’ve already built.
The Financial Impact Of Retention
The business case for focusing on retention is undeniable. A glance across different industries reveals how much performance can vary, but the underlying principle remains the same: it's more profitable to keep a customer than to acquire a new one.
Key Retention Rate Benchmarks Across Industries
Here's a quick look at average customer retention rates in different sectors to help you contextualize your own performance.
Industry
Average Retention Rate
Telecommunications
78%
Financial Services
75%
IT Services
70%
Professional Svcs
65%
SaaS
60%
E-commerce
38%
These benchmarks highlight how industry-specific factors shape customer loyalty. The financial stakes are significant. For AI and data consulting firms, where projects are complex and relationships are built on trust, a small improvement in retention can lead to a substantial increase in revenue and profitability.
For data-driven consultancies like ours at NILG.AI, this metric is even more critical. We leverage predictive analytics to identify clients who might be at risk of churn before they disengage. This strategic approach turns retention from a reactive measure into a proactive tool for sustainable growth.
Once you feel comfortable calculating your retention rate, the next step is to explore effective strategies for improving customer retention and put those insights into action.
How to Actually Calculate Customer Retention: The Core Formulas
Let's move from theory to practice. Calculating your customer retention rate is less complicated than it seems, and it all starts with one core formula. This is your primary method for getting a high-level view of how many customers are staying with you.
It’s clean, simple, and gives you a solid baseline.
Here’s the classic formula you’ll see everywhere:
Customer Retention Rate = [ (Customers at End of Period – New Customers) / Customers at Start of Period ] x 100
Let’s apply this to a real-world scenario. Imagine you run an AI consulting business and started Q2 with 80 active clients. Over the next three months, your team landed 15 new clients. By the end of the quarter, you had a total of 85 active clients.
How did you perform? Let's plug the numbers into the formula:
[ (85 total clients – 15 new clients) / 80 starting clients ] x 100
[ 70 / 80 ] x 100 = 87.5%
Your retention rate for the second quarter was 87.5%. This single number tells a powerful story—it means you successfully kept the vast majority of your existing clients engaged and satisfied through that period.
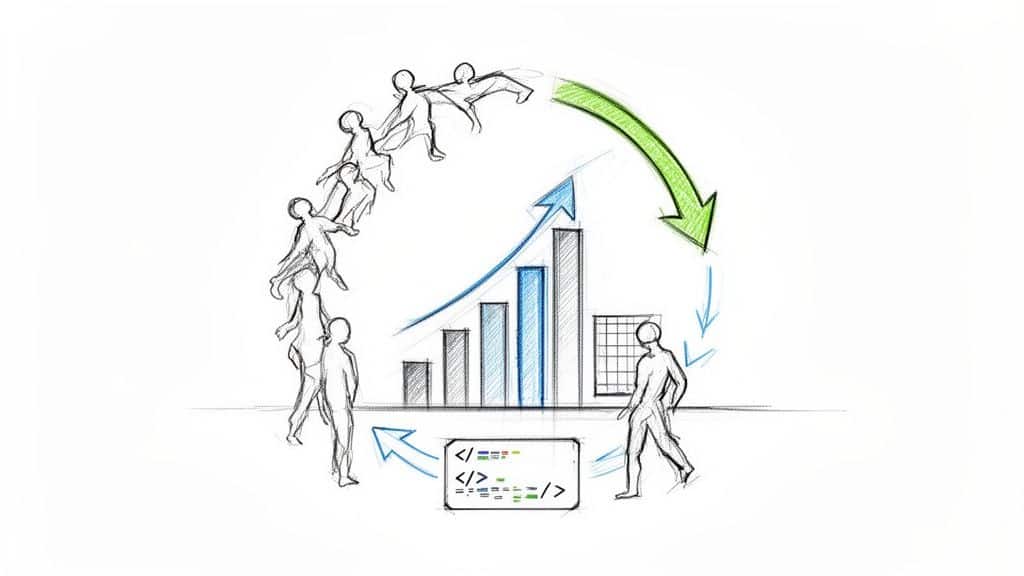
This visual breaks down that exact flow really nicely. You start with a big pool of customers, subtract the brand new ones to isolate your original group, and then see what percentage of that original group is left.
It's all about making sure you're comparing apples to apples—the customers you started with versus the ones who remained.
Going Deeper Than the Basic Formula
While the standard formula is an essential starting point, it only reveals part of the story. To gain truly actionable insights, especially for business models that aren't simple monthly subscriptions, you need to explore more nuanced methods.
Cohort Analysis: This is a strategic game-changer. Instead of viewing all customers as one group, you segment them by their sign-up period—such as your "January 2024 cohort" or "Q3 2023 cohort." Tracking each group's retention over time helps you spot powerful trends. Did the new onboarding process launched in March actually make the "March 2024 cohort" stick around longer than previous ones? Cohort analysis provides the answer.
Rolling Retention: This method is ideal for businesses where customer activity is more sporadic, like project-based consultancies. Instead of a rigid monthly or quarterly window, rolling retention measures whether a customer has been active at any point within a given timeframe, like the last 90 or 180 days. This provides a more realistic view of ongoing engagement when daily or monthly interaction isn't expected.
Think of these calculation methods as different lenses in your analytical toolkit. The basic formula is your wide-angle lens for a broad view, but sometimes you need the zoom lens of cohort analysis or the flexibility of rolling retention to truly understand the drivers of customer loyalty.
Crunching the Numbers in Excel and SQL
Knowing the formulas is one thing, but applying them to your own data is where you unlock real value. Let's walk through how to calculate retention using common business tools, starting with a simple spreadsheet.
A Quick and Dirty Retention Check in Excel
For many data and AI consulting businesses, Excel or Google Sheets is the perfect tool for an initial analysis. It’s accessible, visual, and allows you to quickly validate your numbers before building more complex dashboards.
Let's imagine you want to calculate your retention rate for Q3 (July through September). You only need three key data points:
Customers at the Start: How many active clients did you have on July 1st?
Customers at the End: How many active clients were on your roster on September 30th?
New Customers Acquired: How many new clients signed during those three months?
Once you have these figures, place them in a sheet. For example, you can put them in cells A2, B2, and C2, respectively.
The formula is a direct translation of the one we've discussed. In cell D2, you would type: =((B2-C2)/A2)
Format that cell as a percentage, and you have your retention rate. This is a straightforward process you can easily repeat quarterly to monitor your client-base stability.
Leveling Up with SQL and Cohort Analysis
As your business scales, a simple spreadsheet calculation won't be enough. To dig deeper, SQL becomes an indispensable tool. It allows you to query your customer database directly and perform more sophisticated analyses, such as a cohort analysis.
A cohort is a group of customers who signed up during the same period—for example, all clients who joined in January 2024. By tracking each cohort's behavior separately, you uncover a much richer narrative than a single, company-wide retention metric can provide.
This approach lets you answer critical strategic questions. Did our new project management methodology improve retention for clients who onboarded after its implementation? Are clients acquired through industry event sponsorships more loyal than those from digital marketing campaigns?
Running a query to track these groups over time will produce a cohort chart. This powerful visualization shows you exactly how "sticky" each group of customers is month after month, revealing patterns in their lifecycle.
Here is a foundational SQL query to get you started. This assumes you have a subscriptions table with customer_id, start_date, and end_date. You will likely need to adapt it to your specific database schema, but the core logic is sound.
WITH customer_cohorts AS ( — First, determine the sign-up month for each customer SELECT customer_id, DATE_TRUNC('month', start_date) AS cohort_month FROM subscriptions GROUP BY 1, 2 ), monthly_activity AS ( — Next, generate a series of months to check for activity SELECT customer_id, DATE_TRUNC('month', activity_date) AS activity_month FROM — This would be a table of user actions, logins, or payments customer_activity_log GROUP BY 1, 2 ) — Now, join cohorts with their activity to see who is retained SELECT cohorts.cohort_month, — Calculate the age of the cohort in months (DATE_PART('year', activity.activity_month) – DATE_PART('year', cohorts.cohort_month)) * 12 + (DATE_PART('month', activity.activity_month) – DATE_PART('month', cohorts.cohort_month)) AS month_number, — Count the unique customers active in that month COUNT(DISTINCT cohorts.customer_id) AS retained_users FROM customer_cohorts cohorts LEFT JOIN monthly_activity activity ON cohorts.customer_id = activity.customer_id WHERE activity.activity_month >= cohorts.cohort_month GROUP BY 1, 2 ORDER BY 1, 2;
Think of this query as a strategic template for your analytics team. It’s the bridge from raw data to a clear, strategic picture of customer behavior, helping you understand not just if your clients are staying, but for how long and what initiatives are most effective at keeping them.
Alright, you've crunched the numbers and have your customer retention rate. Whether it's a stellar 92% or a more concerning 75%, what's next? A number in isolation is just data; its strategic value comes from interpretation. Understanding what that percentage means for your business is as important as the calculation itself.
Context is everything. An 85% retention rate for an AI consulting firm with annual contracts is fantastic, indicating strong client partnerships. However, for a monthly B2B SaaS tool, that same 85% could signal a significant churn problem that requires immediate action.
What Is a Good Retention Rate Anyway?
It’s tempting to search for a universal "good" retention rate, but one doesn't exist. Benchmarks are a useful starting point, but don't treat them as absolute truths. Your industry, business model, and contract length all dramatically influence what's considered a healthy rate.
For example, industries with high switching costs like professional services often see retention rates above 80%. In contrast, sectors like retail may struggle to keep rates above 55%. For a specialized AI data consulting firm, comparing our annual contract retention to a high-volume e-commerce store would be meaningless; we are playing different strategic games.
The most powerful benchmark is your own historical performance. Is your retention rate trending upward over time? That indicates your strategies are working. A sudden drop, however, is a signal to investigate the root cause. The ultimate goal is steady, sustainable improvement.
Common Traps That Distort Your Metrics
Accurate calculation is crucial, but several common pitfalls can skew your results and provide a false sense of security. To get a clear, actionable picture, you must avoid these mistakes.
Here are the most common errors to watch for:
Counting New Customers: This is the most frequent mistake. You must exclude customers acquired during the measurement period from your calculation. Including them will artificially inflate your retention rate and can mask a growing churn problem.
Forgetting to Segment: A single, company-wide retention rate can be misleading. True insights emerge from segmentation. You should calculate retention for different customer groups—by project type, company size, or industry. You might discover your overall rate is acceptable, but a critical, high-value segment is churning at an alarming rate.
Working with Bad Data: Inaccurate or incomplete data will invalidate your analysis from the start. If your CRM has inconsistent customer start dates or your billing system doesn't correctly flag contract cancellations, your calculations will be flawed. Addressing underlying data quality issues must be a top priority.
Your customer retention rate is a mirror for your business. An artificially high number might look good in a report, but it prevents you from identifying and fixing the real friction points your clients are experiencing.
Ultimately, you need to look beyond that single percentage. To really understand what your customer data is telling you, it helps to look at how different metrics are distributed. A simple tool like a frequency distribution calculator can help you visualize patterns that a basic average would completely miss.
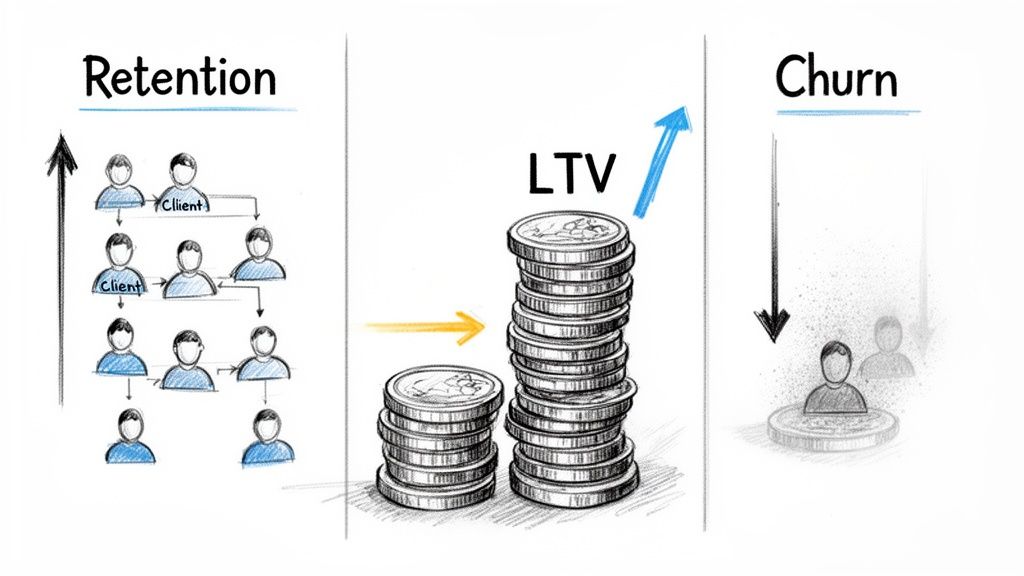
How Retention Connects to Churn and LTV
You've calculated your retention rate, but this metric doesn't exist in a vacuum. To unlock its full strategic value, you must understand its relationship with two other critical metrics: customer churn rate and customer lifetime value (LTV).
Think of retention and churn as two sides of the same coin. They are inverse concepts. If you retained 85% of your customers last quarter, it means you lost the other 15%. That 15% is your churn rate.
While retention celebrates who stayed, churn forces you to ask the critical question: why did the others leave? Answering this question is how you identify and fix weaknesses in your customer journey. You can even get ahead of the problem with predictive analytics. We have a comprehensive guide on predicting customer churn if you want to adopt a more proactive approach.
From Keeping Customers to Growing Their Value
Here’s where the analysis becomes truly powerful. The link between retention and LTV is where strategy translates directly into revenue. LTV represents the total revenue you can reasonably expect from a single customer throughout their entire relationship with your firm.
Every percentage point you add to your retention rate directly increases your average LTV. A client who remains for three years instead of one isn't just a number; they represent years of potential for new projects, expanded service agreements, and powerful word-of-mouth referrals.
For an AI consulting business, this impact isn't just linear; it's exponential.
Consider this scenario:
Client A engages your firm for a one-year project worth $100,000. Their LTV is $100,000.
Client B signs a similar deal, but your service delivery is so strong that you retain them. In year two, they renew and add a $50,000 data automation project. In year three, they are so impressed they refer a new client who closes a significant deal.
Suddenly, Client B’s LTV has far surpassed their initial contract value. This is the power of a retention-focused strategy in action.
Loyal customers can be worth up to 10 times as much as their first purchase. Working on your retention strategy isn't just about customer satisfaction; it's one of the most reliable revenue growth engines you have.
This isn't just an anecdotal observation; the data is clear. Research shows that by their third year with a company, customers spend 67% more than they did in their first six months. By focusing on delivering exceptional value and nurturing client relationships, you build a foundation for organic growth that is far more efficient and profitable than constantly chasing new leads.
Common Questions About Customer Retention
Once you start digging into customer retention metrics, several key questions naturally arise. Knowing the formulas is the first step; applying them strategically in a real-world context is the next. Let's address some of the most common questions.
What Is a Good Retention Rate for a B2B Company?
This is a critical question, and the most accurate answer is: it depends on your specific business model and industry. There is no single magic number.
That said, for most B2B companies, a monthly retention rate of 95% or higher is a strong target. This translates to an annual retention rate of around 60-70%, which serves as a solid benchmark for many subscription-based models.
For a business like an AI consulting firm that operates on long-term annual contracts, the benchmark is significantly higher. In this context, an annual retention rate well above 80% is a key indicator of a healthy, stable client base. The most effective strategy is to first benchmark against your industry, but more importantly, to focus on consistently improving your own metrics quarter over quarter.
How Often Should We Calculate Our Retention Rate?
The optimal frequency for calculating retention depends entirely on your business cycle.
Monthly: For SaaS companies or businesses with monthly subscription models, monthly calculation is essential. It acts as an early warning system for potential issues.
Quarterly & Annually: For most AI consultancies and other businesses focused on long-term contracts or project-based work, a quarterly and annual review provides more meaningful strategic insights.
My recommendation is to automate the reporting so the data is always available. This allows for quick monthly tactical checks while enabling deeper, more strategic dives on a quarterly basis to inform long-term planning.
Can I Calculate Retention for Different Customer Segments?
Not only can you, but you absolutely should. A single, company-wide retention rate is merely a starting point. The most valuable strategic insights are discovered when you segment your customer base and analyze retention for each group.
Averages hide the truth. You might have an acceptable overall retention rate that’s masking a serious churn problem with your most profitable customers.
Segment your data by strategic categories such as:
Company size (e.g., startups vs. enterprise clients)
Industry vertical (e.g., finance vs. healthcare)
Specific service or project type
Acquisition channel (e.g., webinar leads vs. word-of-mouth referrals)
This level of analysis reveals who your most loyal customers are and, crucially, which segments are at risk. This is how you move from measurement to targeted, effective retention strategies.
What Is the Difference Between Retention and Loyalty?
It's easy to use these terms interchangeably, but they represent two different concepts. Understanding the distinction is key to building a resilient business.
Customer retention is a behavioral metric. It is black and white: did a customer continue to do business with you over a specific period? It measures their actions.
Customer loyalty, on the other hand, is an attitudinal metric. It measures how a customer feels about your brand. Are they a vocal advocate? Would they recommend you without hesitation?
Here's the critical insight: a loyal customer is almost always a retained customer, but a retained customer is not always loyal. They might be staying due to contractual obligations, high switching costs, or a simple lack of better alternatives. Your strategic goal should be to build genuine loyalty, as that is the true foundation for high retention and, ultimately, a greater customer lifetime value. To explore this topic further, we have an excellent article on embedding domain knowledge to better estimate customer lifetime value.
At NILG.AI, we help businesses move beyond simple metrics to build AI-powered strategies that drive real growth and improve customer retention. Request a proposal
Like this story?
Subscribe to Our Newsletter
Special offers, latest news and quality content in your inbox.
Signup single post
Recommended Articles
Article
Digital business transformation examples: 10 Real-World Case Studies
Feb 10, 2026 in
Listicle: Examples
Discover digital business transformation examples and how AI, data, and strategy fuel growth with practical, actionable insights.
Master customer retention rate calculation with this practical guide. Learn the formulas, see real-world examples, and get actionable tips for business growth.
We use cookies on our website to give you the most relevant experience by remembering your preferences and repeat visits. By clicking “Accept All”, you consent to the use of ALL the cookies. However, you may visit "Cookie Settings" to provide a controlled consent.
This website uses cookies to improve your experience while you navigate through the website. Out of these, the cookies that are categorized as necessary are stored on your browser as they are essential for the working of basic functionalities of the website. We also use third-party cookies that help us analyze and understand how you use this website. These cookies will be stored in your browser only with your consent. You also have the option to opt-out of these cookies. But opting out of some of these cookies may affect your browsing experience.
Necessary cookies are absolutely essential for the website to function properly. These cookies ensure basic functionalities and security features of the website, anonymously.
Cookie
Duration
Description
cookielawinfo-checkbox-analytics
11 months
This cookie is set by GDPR Cookie Consent plugin. The cookie is used to store the user consent for the cookies in the category "Analytics".
cookielawinfo-checkbox-functional
11 months
The cookie is set by GDPR cookie consent to record the user consent for the cookies in the category "Functional".
cookielawinfo-checkbox-necessary
11 months
This cookie is set by GDPR Cookie Consent plugin. The cookies is used to store the user consent for the cookies in the category "Necessary".
cookielawinfo-checkbox-others
11 months
This cookie is set by GDPR Cookie Consent plugin. The cookie is used to store the user consent for the cookies in the category "Other.
cookielawinfo-checkbox-performance
11 months
This cookie is set by GDPR Cookie Consent plugin. The cookie is used to store the user consent for the cookies in the category "Performance".
viewed_cookie_policy
11 months
The cookie is set by the GDPR Cookie Consent plugin and is used to store whether or not user has consented to the use of cookies. It does not store any personal data.
Functional cookies help to perform certain functionalities like sharing the content of the website on social media platforms, collect feedbacks, and other third-party features.
Performance cookies are used to understand and analyze the key performance indexes of the website which helps in delivering a better user experience for the visitors.
Analytical cookies are used to understand how visitors interact with the website. These cookies help provide information on metrics the number of visitors, bounce rate, traffic source, etc.
Advertisement cookies are used to provide visitors with relevant ads and marketing campaigns. These cookies track visitors across websites and collect information to provide customized ads.