Process mapping isn’t just about connecting boxes and arrows; it’s like getting a blueprint of how your business operates. It helps you find those hidden inefficiencies that can slow things down and impact growth. Think of it as an X-ray, showing you exactly where the bottlenecks are and what’s causing them. This clear visual representation helps teams identify problem areas, improve workflows, and ultimately, achieve better results.
Unveiling Hidden Bottlenecks and Inconsistencies
Many organizations struggle with inconsistent workflows and unexpected bottlenecks. These hidden problems often go unnoticed, quietly impacting productivity and profits. Process maps shed light on these issues, clearly showing where things get stuck, slow down, or go off track. For example, a process map might reveal that a simple approval process actually involves several unnecessary handoffs and delays. Understanding this is the first step to making things better.
Fostering Collaboration and Shared Understanding
Process maps don’t just identify bottlenecks; they also create a common language between different departments. They help break down barriers and build a shared understanding of how things get done. This shared perspective reduces misunderstandings and gets rid of the “that’s not my job” attitude. Plus, process maps help external consultants quickly understand existing procedures and offer valuable advice, leading to even greater efficiency. Creating a process map is an important part of Business Process Management (BPM), helping organizations visualize, analyze, and improve their workflows.
Micro-Decisions and Uncertainty: The Role of AI
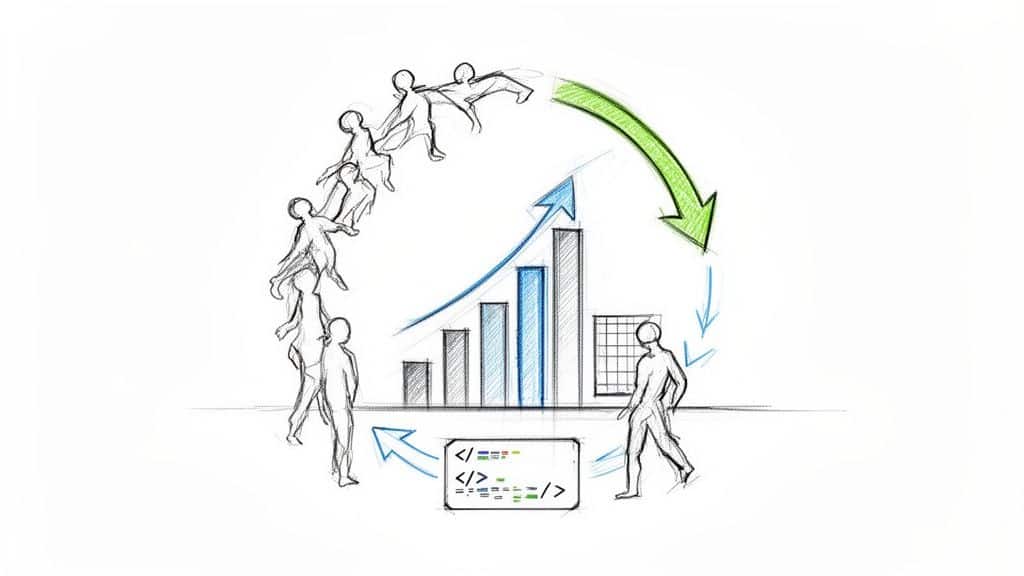
One of the most powerful aspects of process mapping is its ability to highlight the small, everyday decisions that happen in every workflow. These micro-decisions, often made instinctively by experienced team members, can have a big impact on the overall outcome. However, these micro-decisions often involve uncertainty. For instance, a sales rep might offer a discount based on their gut feeling about a client, a decision that isn’t always right.
This is where AI comes in. By adding AI-powered predictions to a process map, businesses can reduce uncertainty in these key decisions. AI algorithms can analyze past data and current conditions to predict the best course of action, essentially automating decision-making and minimizing human error. This shift from reactive to proactive, data-driven choices significantly improves efficiency and leads to more predictable, positive outcomes. This transforms process maps from static images into dynamic tools for continuous improvement and intelligent automation.
Selecting the Right Tools for Your Mapping Journey
Creating a process map isn’t just about drawing boxes and arrows. It’s about carefully choosing the right tools and understanding the little decisions within your process, so you can make them better. The right tools can turn a messy diagram into a powerful plan for efficiency and even automation. This section will help you choose the best software and techniques for your process mapping needs.
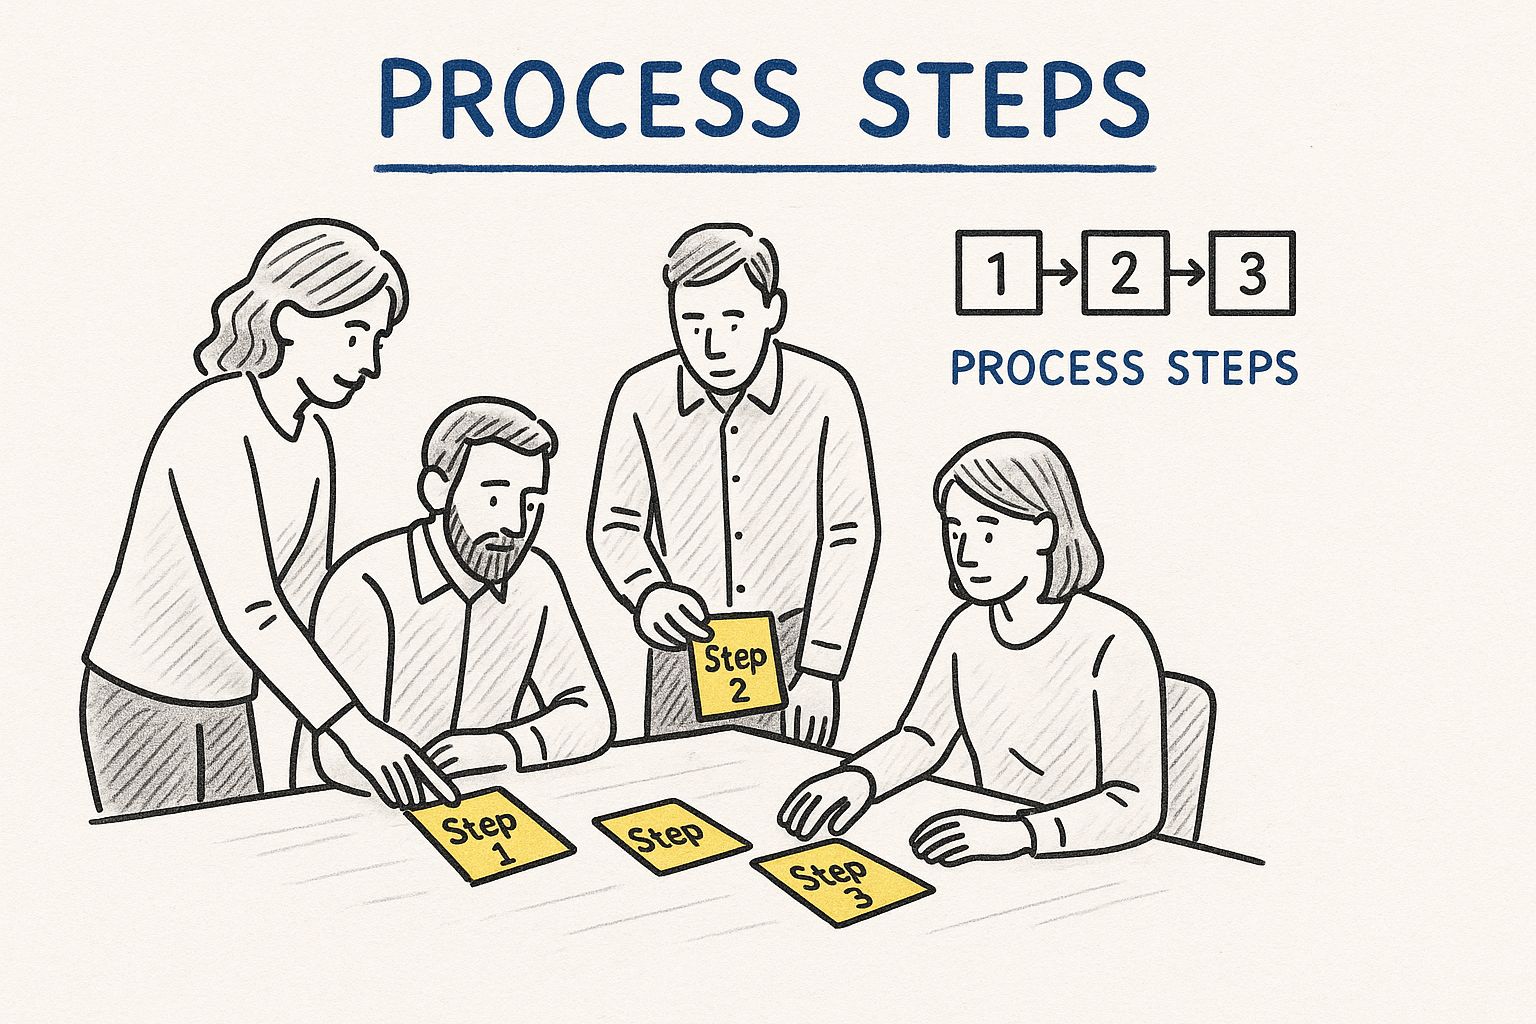
From Sticky Notes to Sophisticated Software
The infographic above shows the beginning stages of process mapping, where a team uses sticky notes to outline the main steps. This simple, visual approach highlights how important clarity and collaboration are in the early stages. From these basic sketches, you can move to more advanced digital tools for detailed analysis and easier teamwork.
Choosing the Best Fit for Your Needs
Several things affect your choice of process mapping software. Think about your budget, how complex your processes are, whether your team needs to collaborate, and if you want to use AI to help with decision-making. Basic flowcharting tools might work for simple workflows. But complex, multi-departmental processes usually need stronger platforms with features like swimlane diagrams and hierarchical mapping.
Using a standard notation like Business Process Model and Notation (BPMN) can really improve clarity and communication across teams. The business process mapping software market is growing fast and is expected to reach USD 82 billion by 2031. This shows how much businesses want effective process optimization solutions. This growth is fueled by the need for clear and standardized business operations. However, challenges remain, such as a skills gap (affecting nearly 35% of organizations) and a lack of BPMN knowledge (affecting over 20% of professionals). Learn more about the current state of process mapping and these challenges here.
To help you compare some popular options, check out this table:
Process Mapping Software Comparison: This table compares the features, pricing, and capabilities of popular process mapping tools to help you choose the best one for your needs.
As you can see, each tool offers a different mix of features and pricing. Consider your specific needs and budget when making your choice.
Embracing Collaboration and AI for Enhanced Decision Making
Collaborative mapping platforms are becoming super important, especially for remote teams. Features like real-time editing, commenting, and version control make teamwork much easier. Plus, adding AI to your process map can greatly improve decision-making.
By mapping every micro-decision, you clearly see where uncertainty exists. For instance, think about a decision point in a customer service process where agents decide whether to give a refund. By mapping the criteria used, AI algorithms can learn to predict if a refund request is valid. This helps agents make faster, more consistent decisions, which makes customers happier and operations more efficient. Check out this interesting article: How to master your AI strategy.
Choosing the right process mapping tools is a big step towards optimizing your workflows and making the most of AI-driven decision automation. Moving from static documentation to a dynamic platform for improvement and automation is key to long-term success in a competitive business environment.
Creating Your First Process Map That Actually Works
Forget all the theoretical stuff; let’s get down to brass tacks. This section walks you through creating a process map that genuinely reflects how work gets done. We’ll focus on those tiny, everyday decisions where AI can truly make a difference. We’ll cover how to define boundaries, dig up hidden workarounds, and navigate disagreements about “how things really work.”
Defining Clear Boundaries and Scope
First things first: define the starting and ending points of your process. It’s like setting the frame for a photo. You need to decide what’s in the picture and what’s out. This prevents scope creep, where the process map tries to include everything and becomes a total mess. For example, if you’re mapping your sales process, your start point might be “Lead Generated” and the end point “Deal Closed.” Everything in between gets mapped; activities like marketing campaigns (lead generation) or customer success (post-sale) stay outside the frame.
Uncovering the Hidden Workarounds
Formal procedures rarely tell the whole story. Teams often develop informal workarounds to get around bottlenecks or system limitations. These workarounds are essential for understanding how work actually happens. The key to uncovering them? Good interviewing. Don’t just ask, “What’s the process?” Ask things like, “What do you do when the system crashes?” or “How do you handle rush orders?” These kinds of questions reveal the hidden steps, the micro-decisions your team makes every day to keep things moving. For more general information and use cases, check out this process mapping blog.
Facilitating Agreement and Resolving Discrepancies
Teams often disagree on how processes work, especially in complex or multi-departmental situations. Making sure everyone’s on the same page is vital. Visualizing the process on a whiteboard and letting everyone contribute can really help create a shared understanding. When discrepancies pop up, asking “Why is this step done this way?” or “What’s the impact of this decision?” can help identify the root cause of the disagreement and find some common ground.
Capturing the Micro-Decisions and Quantifying Uncertainty
Within any process, there are tons of small decisions being made. These micro-decisions, while seemingly minor, add up and affect overall efficiency. Document each decision point, including the criteria used, the information needed, and the possible outcomes. Crucially, try to quantify the uncertainty around each decision. For example, if a decision relies on a sales representative’s “gut feeling,” the uncertainty is high. This detailed mapping highlights areas ripe for AI improvement.
Leveraging AI for Predictive Decision-Making
Once you’ve mapped the micro-decisions and their uncertainty, you can start thinking about how AI can step in. For decisions with high uncertainty, AI algorithms can analyze past data, current conditions, and even external factors to make predictions. These predictions lead to better decision-making and less guesswork. For example, AI can predict customer churn or lead conversion, allowing for more targeted and effective actions. By incorporating AI into your process map, you go from simply documenting “what is” to predicting “what could be.” This turns your map into a dynamic tool for continuous improvement, driving efficiency and informed decision-making. You’ll be able to spot opportunities for automation and use your process map as a blueprint for intelligent process improvement.
Mastering Advanced Mapping For Complex Processes
So, you’ve got the basics of process mapping down? Awesome! Now, let’s crank things up a notch and explore how to visualize those really intricate workflows. We’re talking about going beyond simple, straightforward processes and diving into methods that capture all the twists and turns of complex systems. This is where advanced mapping really comes into its own.
Swimlane Diagrams: Clarifying Responsibilities
Ever seen a swimming pool divided into lanes? A swimlane diagram works in a similar way. Each lane represents a different team or department involved in the process. This visual separation makes it super clear who’s responsible for each step. This keeps everyone on the same page and helps teams stay accountable. Think about a customer onboarding process: you could have separate swimlanes for sales, marketing, and customer support, clearly showing each team’s contribution to the overall flow.
Hierarchical Maps: Connecting The Big Picture To The Details
When you’re dealing with a massive, complicated process, hierarchical maps are your best friend. These maps provide different levels of detail. Executives get the high-level overview, while individual teams can zoom in on their specific areas. This layered approach keeps things clear at every level, from the big-picture strategy to the everyday tasks. It’s kind of like how Google Maps lets you zoom out to see the whole country or zoom in to see individual streets.
Documenting Conditional Paths And Decision Trees
Let’s be honest, real-world processes are rarely straightforward. They’re full of decisions and different paths based on various conditions. Advanced process maps need to capture this complexity. This involves using decision points, often shown as diamonds, to illustrate where the process branches off based on specific criteria. By carefully mapping these decision trees, you get a much clearer understanding of what’s influencing your process flow.
Integrating Data For Quantitative Improvements
Want to really optimize your processes? Don’t stop at simple visualization. Bring in some hard data! Adding information about time, cost, and resources gives you a much richer understanding of performance. This helps you spot bottlenecks, not just in the steps themselves, but also in how resources are being used. For example, visualizing the time spent on each step can reveal unexpected delays and highlight areas for improvement. Adding methodologies like layering can boost your process mapping even further, allowing for deeper analysis and potentially eliminating up to 80% of process problems. Want to learn more? Check this out: Layering: A New Approach to Business Process Mapping.
Micro-Decisions And AI: Automating The Uncertain
As we’ve discussed, accurately capturing those small, everyday decisions – the micro-decisions – is key to optimizing processes. At each decision point, be sure to define the criteria used, the data needed, and how much uncertainty is involved. This detailed documentation sets the stage for bringing in AI-powered solutions. AI algorithms can analyze the mapped data, predict outcomes, and even automate decisions based on predefined rules or learned patterns. Want to know more about automating processes with AI? Take a look at this: How to Master Intelligent Process Automation. This combo of detailed process mapping and AI transforms static documentation into a dynamic tool for continuous improvement and automated intelligence. By understanding the uncertainties within each micro-decision, you can strategically use AI to boost efficiency and minimize human error.
Mapping the Invisible: Capturing Crucial Decision Points
The real magic of a process map isn’t just showing the steps, but uncovering the decision points that actually drive your results. These decisions, both big and small, are the make-or-break moments where your team’s choices can lead to either success or, well, not-so-much success. This section explores how to find these critical points, analyze the uncertainty involved, and see how AI can turn them into automation goldmines.
Identifying Formal and Informal Decision Points
Decision points come in two main types: formal and informal. Formal decisions are typically documented, like an approval process with set rules. Think of it like a well-worn path, everyone knows where it goes.
Informal decisions, on the other hand, are often undocumented, “off-road” judgment calls based on experience and gut instinct. A salesperson offering a discount based on a hunch is a classic example of an informal, yet important, decision point. Identifying both formal and informal decisions is essential for a complete process map.
Revealing Decision Criteria and Uncertainty
Once you’ve located your decision points, it’s time to dive deeper and figure out the criteria behind them. For formal decisions, this might be clearly written down. But for those informal ones, you’ll need to chat with your team. Ask them things like, “What goes into making this decision?” or “What information do you consider?” This helps uncover the hidden reasoning driving these choices.
Next, look at the uncertainty at each decision point. High uncertainty means the results are hard to predict, often relying on guesswork. This is where AI can become your new best friend.
Quantifying Decision Uncertainty and Its Impact
Uncertainty isn’t just a vague feeling, it can be measured. Depending on the type of decision, you might use historical data to calculate the probability of different outcomes. Imagine a sales team discovers that only 60% of “gut feeling” discounts actually close deals. That’s a red flag for high uncertainty!
Measuring uncertainty isn’t just a numbers game; it has a real impact on your bottom line and customer experience. Unpredictable outcomes can lead to inconsistent service, missed sales opportunities, or higher costs.
Using AI to Predict and Automate Decisions
Want to learn more about data-driven decisions? Check out this article: How to master data-driven decision-making. AI can sift through past data and current conditions to predict the best choices at those tricky points of uncertainty. This turns guesswork into smart decisions, boosting both consistency and efficiency.
Picture the sales team now armed with an AI tool that analyzes customer data and predicts the chance of closing a deal with a discount. This empowers them to offer discounts strategically, increasing close rates and profits.
Mapping Decision Types for Automation Opportunities
Not all decisions are created equal when it comes to automation. A simple rule-based decision, like approving small expenses, can be easily automated. More complex decisions with many variables might still benefit from AI-powered predictions to assist human judgment.
To illustrate this, let’s look at a table summarizing the different types of process decisions and their characteristics:
Types of Process Decisions and Their Characteristics
Decision Type
Characteristics
Typical Uncertainty Level
Information Requirements
Automation Potential
Examples
Rule-based
Predefined criteria, consistent outcomes
Low
Clearly defined rules and thresholds
High
Approving expense reports under $100, automatically routing customer inquiries
This table shows how understanding the type of decision helps you identify the best opportunities for automation.
By categorizing your decision points, you essentially create a roadmap for automation, showing exactly where AI can make the biggest difference. This transforms your process map from a static document into a dynamic blueprint for improvement and intelligent automation. Mapping these often-invisible decision points is the key to unlocking where standardization, training, or AI can supercharge your processes.
Transforming Decisions Into Automated Intelligence
Your process map isn’t just a document; it’s a blueprint for automation. Think of it as a guide to where you can implement AI, transforming decision points into opportunities for intelligent action. By understanding the uncertain elements of each decision, you can strategically apply AI to create a more efficient and dynamic process.
Machine Learning: Predicting Outcomes and Spotting Opportunities
Machine learning algorithms can dive into the data of your process map, finding hidden patterns and predicting what might happen next. This goes way beyond what humans can usually spot, revealing areas ripe for optimization. For instance, by crunching past sales data, AI could predict which leads are most likely to convert, letting sales teams focus their energy and close more deals. This predictive power turns a static document into a dynamic forecasting tool.
AI-Assisted Decision Making: Complementing Human Judgment
AI isn’t about replacing human judgment, it’s about making it better. AI can offer data-driven insights and predictions, helping people make smarter decisions at critical points. This is especially useful in uncertain situations, where decisions traditionally relied on gut feelings or guesses. Imagine loan approvals: AI can analyze applicant data, predicting the chance of default, and empowering loan officers to make more informed choices. This blend of human experience and AI insights leads to more accurate and consistent results.
Real-World Examples of AI-Driven Automation
Lots of organizations are already using AI to automate decisions based on process maps. Routine approvals, like expenses, can be fully automated using pre-set rules. More complex decisions, like dynamic pricing, can use AI predictions to change prices instantly, responding to market demand and competitors. This frees up human employees for more strategic, creative work.
Process Mining: Continuous Improvement and Adaptation
Process mining takes things up a notch by continuously comparing how your process actually runs against the ideal outlined in your map. This reveals deviations and bottlenecks, giving you chances to refine processes over time. It’s a constant feedback loop, keeping your process map relevant and effective as things change. Imagine process mining showing that a step in manufacturing consistently takes longer than planned, highlighting a potential area for improvement or automation.
From Documentation to Automation: A Blueprint for Success
By mapping your process, pinpointing key decisions, and quantifying uncertainties, you’re building a targeted plan for applying AI. This turns your process map from a static document into a dynamic blueprint for intelligent automation. You can see exactly where standardization, training, or AI implementation will deliver the biggest impact, boosting efficiency and minimizing mistakes. This allows your organization to not only understand its processes, but to shape them for greater success.
Ready to transform your business processes with AI? Visit NILG.AI to discover how our AI solutions can unlock new levels of efficiency, automate decisions, and drive growth. We offer tailored strategies, intelligent automation tools, and expert training to empower your teams and optimize your workflows. Let us help you turn your process map into a roadmap for success.
Master customer retention rate calculation with this practical guide. Learn the formulas, see real-world examples, and get actionable tips for business growth.
We use cookies on our website to give you the most relevant experience by remembering your preferences and repeat visits. By clicking “Accept All”, you consent to the use of ALL the cookies. However, you may visit "Cookie Settings" to provide a controlled consent.
This website uses cookies to improve your experience while you navigate through the website. Out of these, the cookies that are categorized as necessary are stored on your browser as they are essential for the working of basic functionalities of the website. We also use third-party cookies that help us analyze and understand how you use this website. These cookies will be stored in your browser only with your consent. You also have the option to opt-out of these cookies. But opting out of some of these cookies may affect your browsing experience.
Necessary cookies are absolutely essential for the website to function properly. These cookies ensure basic functionalities and security features of the website, anonymously.
Cookie
Duration
Description
cookielawinfo-checkbox-analytics
11 months
This cookie is set by GDPR Cookie Consent plugin. The cookie is used to store the user consent for the cookies in the category "Analytics".
cookielawinfo-checkbox-functional
11 months
The cookie is set by GDPR cookie consent to record the user consent for the cookies in the category "Functional".
cookielawinfo-checkbox-necessary
11 months
This cookie is set by GDPR Cookie Consent plugin. The cookies is used to store the user consent for the cookies in the category "Necessary".
cookielawinfo-checkbox-others
11 months
This cookie is set by GDPR Cookie Consent plugin. The cookie is used to store the user consent for the cookies in the category "Other.
cookielawinfo-checkbox-performance
11 months
This cookie is set by GDPR Cookie Consent plugin. The cookie is used to store the user consent for the cookies in the category "Performance".
viewed_cookie_policy
11 months
The cookie is set by the GDPR Cookie Consent plugin and is used to store whether or not user has consented to the use of cookies. It does not store any personal data.
Functional cookies help to perform certain functionalities like sharing the content of the website on social media platforms, collect feedbacks, and other third-party features.
Performance cookies are used to understand and analyze the key performance indexes of the website which helps in delivering a better user experience for the visitors.
Analytical cookies are used to understand how visitors interact with the website. These cookies help provide information on metrics the number of visitors, bounce rate, traffic source, etc.
Advertisement cookies are used to provide visitors with relevant ads and marketing campaigns. These cookies track visitors across websites and collect information to provide customized ads.