Ready to transform your Power BI reports from good to great? This roundup delivers eight essential best practices Power BI users need to create efficient, insightful, and visually stunning dashboards. We’ll cover key areas like data modeling, DAX, performance tuning, security, and governance. Whether you’re a seasoned Power BI developer or just starting out, these tips will boost your skills and take your reports to the next level.
Why are these best practices important? They directly impact the performance, accuracy, and maintainability of your reports. Poorly designed models can lead to slow loading times and inaccurate insights. Neglecting security can expose sensitive data. A lack of governance can create chaos in your workspaces. This listicle gives you the knowledge to avoid these pitfalls.
We’ll dive into specific, actionable advice you can implement immediately. No vague theories or generic tips here – just practical strategies to optimize your Power BI workflow. This listicle offers fresh perspectives on common challenges, ensuring you’re equipped to handle any Power BI project with confidence. Here’s a sneak peek at what we’ll cover:
Data Model Optimization and Star Schema Design
DAX Best Practices and Performance Optimization
Incremental Data Refresh Strategy
Report Performance Optimization
Row-Level Security (RLS) Implementation
Version Control and Development Lifecycle Management
Data Gateway Configuration and Management
Workspace Organization and Governance
1. Data Model Optimization and Star Schema Design
A well-structured data model is the bedrock of any successful Power BI report. Think of it as the foundation of a house: if it’s shaky, everything built on top will be too. This is where the star schema shines. By organizing your data into fact tables (what happened?) and dimension tables (who, what, where, when, and why?), you create a robust and efficient structure that Power BI can easily digest. This foundational practice ensures optimal performance, maintainability, and user experience.
Understanding the Star Schema
The star schema gets its name from its visual resemblance to a star, with a central fact table surrounded by radiating dimension tables. The fact table contains your quantitative data – the numbers you want to analyze, like sales figures or website visits. Dimension tables provide context to these numbers with descriptive attributes, like product categories, customer demographics, or dates.
For instance, in a retail analytics scenario, your Sales fact table might contain the transaction amount, quantity sold, and product ID. Your dimension tables would then provide details about the product (Product dimension), the customer (Customer dimension), and the date of the transaction (Date dimension).
Why Star Schema Matters
Using a star schema offers several key advantages for your Power BI reports:
Performance: Power BI can quickly retrieve and process data, leading to faster report loading times.
Maintainability: Changes to your data model are easier to implement and less likely to introduce errors.
User Experience: A well-structured model allows for intuitive data exploration and analysis.
Actionable Tips for Star Schema Design
Here are a few practical tips to optimize your data model using star schema principles:
Always create a dedicated Date dimension table: This allows for consistent time-based analysis and simplifies calculations.
Use integer keys for relationships: Integer keys are more efficient than text keys for joining tables.
Keep dimension tables as small as possible: This reduces the overall size of your data model and improves query performance.
Use Model View to visually organize table relationships: This makes it easier to understand and manage your data model. Learn more about data model optimization and star schema design https://nilg.ai/202505/data-science-architecture/.
This method, popularized by the Kimball Group and widely supported by Microsoft, is a proven approach to building efficient and scalable data models. Experts like Alberto Ferrari and Marco Russo (SQLBI) also champion its use for Power BI development.
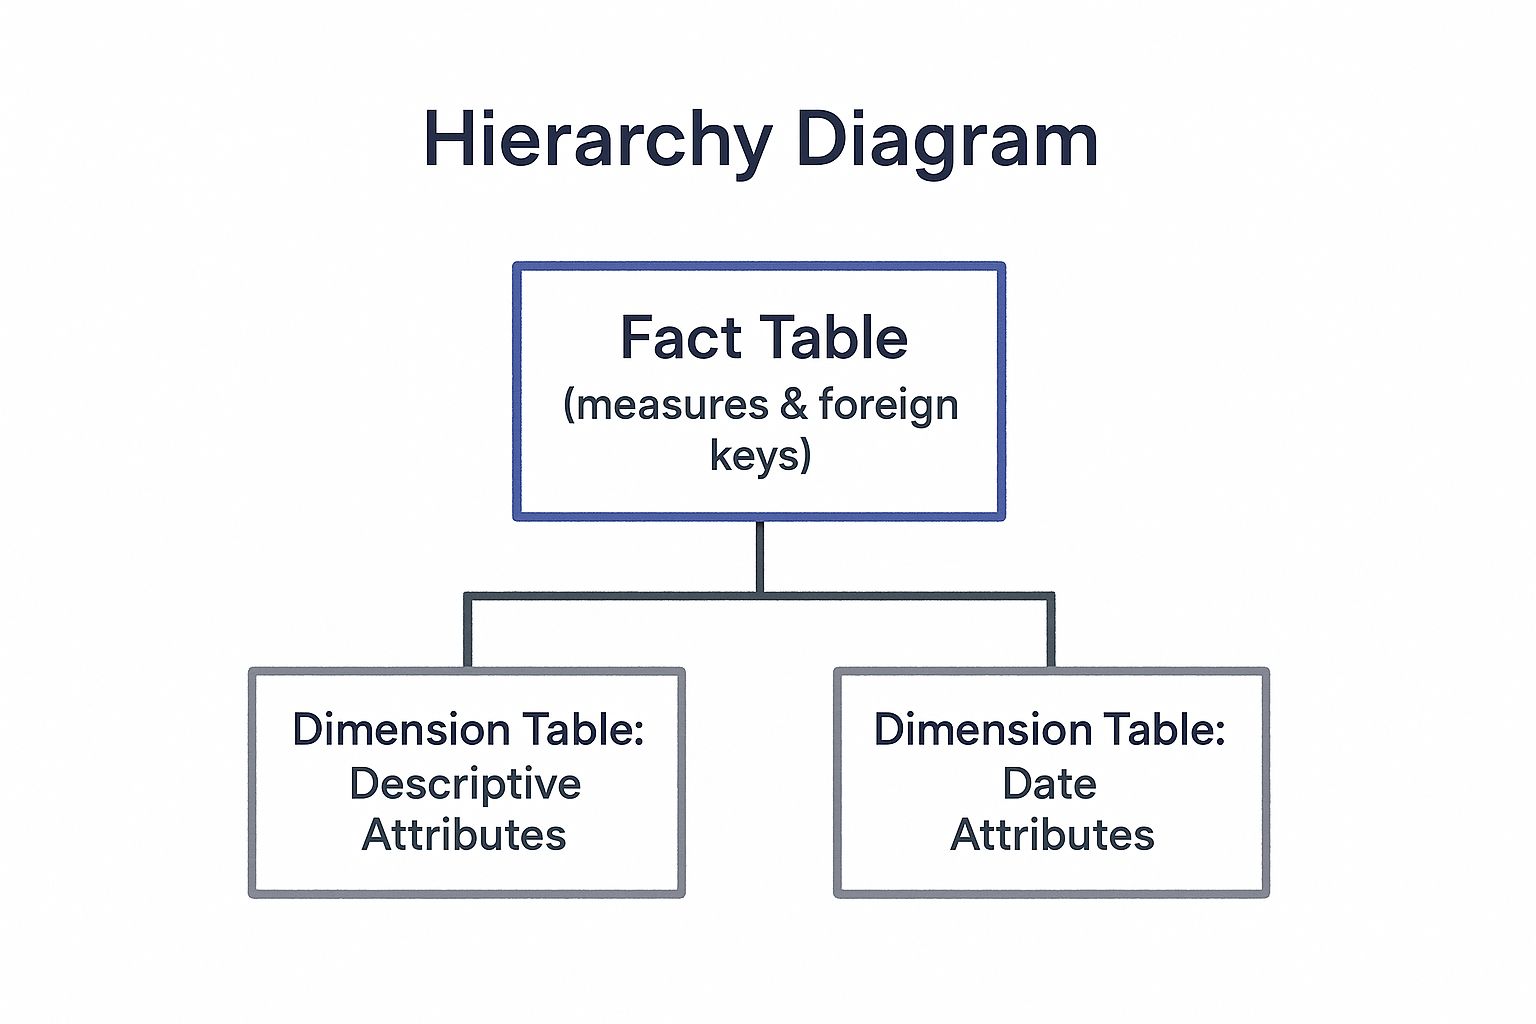
The following infographic illustrates the hierarchical structure of a star schema, emphasizing the central role of the fact table and its relationships with the dimension tables.
As the infographic shows, the Fact Table contains the core measures and foreign keys that connect to the surrounding dimension tables. These Dimension Tables provide context through descriptive attributes and specifically, date-related attributes. This clear separation of concerns is crucial for optimizing performance and maintaining a clean data model, making star schema design a best practice for any Power BI project.
2. DAX Best Practices and Performance Optimization
Writing efficient DAX (Data Analysis Expressions) is crucial for creating high-performing Power BI reports. Think of DAX as the language your reports speak to understand and analyze data. If the language is clunky and inefficient, your reports will be slow and frustrating. Following best practices ensures your DAX formulas are accurate, fast, and easy to maintain, contributing directly to a smooth and insightful user experience.
Understanding DAX Fundamentals
DAX is a formula and query language specifically designed for working with analytical data models. It’s used to create calculated columns, measures, and tables that enhance your data analysis capabilities within Power BI. Understanding the core functions and syntax of DAX is the first step to writing effective formulas. Mastering DAX allows you to perform complex calculations and derive valuable insights that would be difficult to achieve with standard Power BI features.
Why DAX Optimization Matters
Optimizing your DAX code directly impacts report performance. Inefficient DAX can lead to slow loading times, frustrating user experiences, and difficulty in scaling your reports as data volumes grow. Well-written DAX, on the other hand, leads to quicker insights and a smoother analytical workflow. This makes DAX optimization a key best practice for any Power BI developer.
Actionable Tips for DAX Optimization
Here are some practical tips for writing efficient DAX:
Use Variables: Break down complex calculations into smaller, manageable steps using variables. This improves readability and often boosts performance. For example, store the result of SAMEPERIODLASTYEAR in a variable before using it in further calculations.
Avoid FILTER on Large Tables: Using FILTER on large tables can be computationally expensive. Instead, try using boolean expressions within CALCULATE for better performance.
Leverage CALCULATE Efficiently:CALCULATE is a powerful function, but it needs to be used wisely. Combine it with filter expressions to precisely control the context of your calculations. For example, calculate running totals efficiently by combining CALCULATE with date filters.
Format Measures: Ensure your measures are formatted correctly for clear communication. Use appropriate number formatting to display values as percentages, currencies, or other relevant formats.
Examples of Optimized DAX
Consider these examples:
Sales Growth: Use SAMEPERIODLASTYEAR to efficiently compare current sales with the same period in the previous year.
Customer Segmentation: Combine RANKX with conditional logic to segment customers based on their purchasing behavior.
Inventory Turnover: Use CALCULATE and careful context manipulation to accurately calculate inventory turnover ratios.
By following these DAX best practices, you can significantly improve the performance and maintainability of your Power BI reports, empowering you to deliver faster, more insightful data analysis. This method, popularized by experts like Alberto Ferrari and Marco Russo (SQLBI), is crucial for building efficient and effective Power BI solutions.
3. Incremental Data Refresh Strategy
A well-optimized Power BI report isn’t just about fancy visuals; it’s about efficiency under the hood. One of the most powerful ways to boost performance and cut down on resource consumption is by implementing an incremental data refresh strategy. Think of it like updating a webpage – you wouldn’t reload the entire page every time a small change is made, right? Incremental refresh works on the same principle: only the new or changed data is processed, leaving the rest untouched. This approach drastically reduces refresh times, server load, and resource consumption, all while keeping your data current and accurate.
Understanding Incremental Refresh
Instead of refreshing your entire dataset every time, incremental refresh allows you to specify a rolling window of data to update. This means you can refresh just the last day’s worth of sales transactions, the last hour’s sensor readings, or any other time-based increment that makes sense for your data. The older data outside of this window remains static, saving valuable time and resources.
For example, imagine a sales dashboard tracking millions of transactions. With a full refresh, processing this volume of data could take hours. But with incremental refresh, you could set it to update just the current day’s transactions, reducing the refresh time to minutes.
Why Incremental Refresh Matters
The benefits of incremental refresh are hard to ignore:
Faster Refresh Times: Updates are completed much faster, providing users with near real-time data.
Reduced Server Load: Less strain on your data sources and Power BI service.
Lower Resource Consumption: Optimize your Azure costs by processing only the necessary data.
Improved User Experience: Faster reports mean happier users.
Actionable Tips for Implementing Incremental Refresh
Here’s how to get started with incremental refresh:
Reliable Datetime Column: Ensure your source tables have a reliable datetime column for filtering. This is crucial for defining the refresh window.
Start Small and Optimize: Begin with a conservative refresh range (e.g., 1 day) and gradually increase it as needed, monitoring performance along the way.
Monitor and Adjust: Regularly monitor refresh performance and adjust your policies as data volumes and business needs evolve.
Thorough Testing: Test your incremental refresh setup thoroughly in a development environment before deploying to production.
Query Folding: Consider data source capabilities and strive for query folding to push down filtering to the source system for maximum efficiency.
When to Use Incremental Refresh
Incremental refresh is ideal for datasets that:
Grow over time: Large datasets with continuous data additions benefit the most.
Have historical data: Data that doesn’t require frequent updates can remain static outside the refresh window.
Demand frequent updates: Scenarios requiring near real-time data can leverage the speed of incremental refresh.
This approach, championed by the Microsoft Power BI Product Team and experts like Christian Wade, is a game-changer for managing large datasets in Power BI. It’s a best practice for ensuring efficient data updates, optimized resource utilization, and ultimately, a better user experience.
4. Report Performance Optimization
A snappy Power BI report is a happy Power BI report. Nobody likes staring at a loading screen, especially when they need data insights fast. Report performance optimization is all about making your reports load quickly and respond smoothly to user interactions. This means tweaking visuals, streamlining queries, and leveraging Power BI’s performance features to create a seamless user experience. Think of it as fine-tuning a race car engine for maximum speed and efficiency.
Understanding Report Performance
Report performance boils down to two key factors: load time and interactivity. Load time is how long it takes for the report to initially display. Interactivity is how quickly the report responds when users click, filter, or interact with visuals. Both are crucial for a positive user experience. Slow load times lead to frustration, while sluggish interactivity hinders exploration and analysis.
For instance, imagine an executive dashboard that takes 30 seconds to load. By the time the data appears, the meeting’s already moved on. Or picture a sales report that lags every time you apply a filter – frustrating, right? Optimizing report performance addresses these pain points, ensuring your reports deliver insights quickly and efficiently.
Why Report Performance Matters
Fast and responsive reports are essential for several reasons:
User Satisfaction: Nobody likes waiting. Quick load times and smooth interactivity make for happy users.
Productivity: Faster reports mean faster insights, allowing users to make quicker decisions and be more productive.
Adoption: A well-performing report is more likely to be used and adopted by the organization.
Reduced Costs: Optimized reports consume fewer resources, potentially lowering your Power BI service costs.
Actionable Tips for Report Performance Optimization
Here are some practical tips to boost your report’s performance:
Use the Performance Analyzer: This built-in tool pinpoints performance bottlenecks in your report, showing you exactly which visuals are slowing things down.
Limit Visuals per Page: Aim for a maximum of 6-8 visuals per page. Too many visuals can overload the report.
Leverage Drillthrough Pages: Instead of cramming everything onto one page, use drillthrough pages for detailed analysis. This keeps initial load times down.
Choose the Right Visuals: Use simple visuals for simple data. Avoid complex visuals when a simpler chart will do.
Optimize Visual Interactions: Configure interactions between visuals strategically. This reduces unnecessary queries and speeds up filtering.
This approach, championed by the Power BI community and Microsoft’s performance team, ensures efficient and responsive reports. It’s a best practice for any Power BI project, especially those dealing with large datasets or complex visualizations. Optimizing report performance is a key component of building effective and engaging Power BI solutions. By implementing these best practices power bi users can ensure their reports are both visually appealing and performant.
5. Row-Level Security (RLS) Implementation
Imagine having a single Power BI dataset serving various user groups, each with different access permissions. Sales managers see their region’s data, HR accesses employee information based on hierarchy, and finance analyzes budgets by department. That’s the power of Row-Level Security (RLS). It’s like a data gatekeeper, ensuring users only see what they’re authorized to view, crucial for data governance and compliance in Power BI. This best practice lets you maintain a single, centralized dataset while enforcing granular data access control.
Understanding Row-Level Security
RLS filters data at the row level, dynamically restricting access based on user identity. Think of it as applying a personalized filter to the data. When a user interacts with a report, RLS automatically filters the underlying data based on predefined rules. This ensures that users only see relevant information without needing separate datasets for each user group.
For example, a sales report can use RLS to show each sales manager only the data for their region. This is done by creating roles in Power BI and defining filter expressions (DAX) that map users to their respective regions.
Why RLS is Essential
RLS is invaluable for several reasons:
Simplified Data Management: Maintain a single dataset instead of creating and managing multiple copies for different user groups.
Enhanced Security: Protect sensitive data by restricting access to authorized personnel.
Improved Compliance: Meet regulatory requirements for data privacy and access control.
Efficient Reporting: Deliver personalized reports without complex data manipulation.
Actionable Tips for RLS Implementation
Test Thoroughly: Use the ‘View as Role’ feature in Power BI Desktop to verify RLS rules before deploying to production. This allows you to see the data as different users would, ensuring accuracy and preventing unintended data exposure.
Keep it Simple: Start with basic RLS rules and gradually increase complexity as needed. Overly complex DAX expressions can impact performance and be difficult to maintain. Clear documentation is also essential for troubleshooting and future modifications.
Leverage User Functions: Use USERNAME() or USERPRINCIPALNAME() DAX functions to dynamically filter data based on the logged-in user’s email address or identity.
Security Dimension Table: For complex organizational hierarchies or access patterns, create a dedicated security dimension table. This table maps users to different security groups or data access levels. This makes managing RLS rules more organized and scalable.
Monitor Performance: After implementing RLS, monitor query performance to identify potential bottlenecks. RLS can sometimes impact report loading times, especially with complex filters.
RLS, championed by the Microsoft Power BI Security Team and data governance experts, is a powerful tool for any organization working with sensitive data. It’s a crucial best practice for achieving both efficient reporting and robust data security within Power BI. It’s how you can leverage the power of a single dataset while providing personalized and secure data access to all users.
6. Version Control and Development Lifecycle Management
Building a Power BI report isn’t a one-and-done deal. It’s a living, breathing thing that evolves over time. Think of it like a software development project – you need proper version control and a structured development lifecycle to avoid chaos. Version control and development lifecycle management bring structure and predictability to your Power BI projects, ensuring quality, collaboration, and maintainability. This practice becomes especially crucial in enterprise environments where multiple developers work on complex reports.
Understanding the Need for a Structured Approach
Imagine multiple developers making changes to the same Power BI report simultaneously. Without version control, you risk overwriting each other’s work, introducing errors, and creating a maintenance nightmare. A structured development lifecycle, coupled with version control, provides a clear process for managing changes, testing updates, and deploying reports to different environments (development, test, production).
For instance, a financial reporting team might use Azure DevOps to manage quarterly report updates, ensuring each change is tracked and tested before deployment. Multi-developer analytics teams can leverage Git branches for feature development, merging changes into the main branch only after thorough review and testing. Even consulting firms can benefit, managing client deliverables through structured release cycles and maintaining a clear history of changes.
Why Version Control and a Development Lifecycle are Essential
Implementing these practices provides numerous benefits for your Power BI projects:
Collaboration: Multiple developers can work on the same report simultaneously without stepping on each other’s toes.
Version History: Track changes, revert to previous versions, and understand the evolution of your reports.
Quality Assurance: Implement testing procedures to catch errors before they reach production.
Maintainability: A structured approach simplifies ongoing maintenance and updates.
Reduced Risk: Minimize the chance of deploying faulty reports that could impact business decisions.
Actionable Tips for Implementing Version Control
Here are some practical tips to get started:
Use Power BI deployment pipelines: These pipelines enable seamless promotion of reports between workspaces (development, test, production).
Implement naming conventions: Standardized naming for files, measures, and objects improves clarity and consistency.
Document changes: Describe changes and requirements in version control commits to provide context.
Establish code review processes: Peer review of DAX and M code ensures quality and best practices are followed.
Create automated testing scripts: Automate the testing of critical calculations and data loads to catch regressions.
These practices are championed by Microsoft with Power BI Premium features and are rooted in DevOps community best practices. Enterprise BI development teams and software development lifecycle methodologies further emphasize the importance of these concepts. Learn more about Version Control and Development Lifecycle Management https://nilg.ai/202505/machine-learning-model-deployment/.
By adopting a robust version control system and a well-defined development lifecycle, you’ll transform your Power BI development from a chaotic process to a streamlined, efficient, and reliable one, ultimately leading to higher quality reports and better business decisions. This practice is a cornerstone of successful Power BI implementations, particularly in larger organizations and teams.
7. Data Gateway Configuration and Management
Connecting your Power BI reports to on-premises data sources? Then you absolutely need to master the art of Data Gateway configuration and management. Think of the gateway as a secure bridge, allowing your cloud-based Power BI service to access data residing in your local network or private cloud without exposing it directly to the internet. This crucial component ensures a reliable and performant connection for refreshing your dashboards and reports.
Understanding the On-premises Data Gateway
The On-premises Data Gateway acts as a intermediary, securely transferring data between your on-premises data sources and the Power BI cloud service. It establishes an encrypted connection, ensuring your data stays safe during transit. This is essential for organizations that rely on internal databases, file servers, or other data sources that are not publicly accessible.
For instance, a manufacturing company might use a gateway to connect Power BI to its on-premises ERP system. This allows real-time production data to be visualized in dashboards, providing valuable insights into operational efficiency. Similarly, financial institutions can leverage gateways to connect to internal databases for regulatory reporting and compliance.
Why Proper Gateway Configuration Matters
Proper gateway configuration is crucial for several reasons:
Security: The gateway enables secure access to on-premises data without needing to open firewall ports directly.
Performance: Optimizing gateway settings can significantly improve data refresh speeds and overall report performance.
Reliability: Configuring gateway clusters ensures high availability and minimizes downtime for your Power BI reports.
Actionable Tips for Gateway Management
Here are some practical tips to optimize your gateway configuration:
Dedicated Server: Install the gateway on a dedicated server with adequate CPU, memory, and network bandwidth. Avoid installing it on a domain controller or a machine with heavy workloads.
High Availability: For mission-critical data sources, configure a gateway cluster with multiple gateway members. This ensures redundancy and prevents data refresh failures if one gateway member becomes unavailable.
Resource Monitoring: Regularly monitor gateway performance and resource utilization using the Gateway Management app. This allows you to proactively identify and address potential bottlenecks.
Least Privilege: Use service accounts with the minimum required permissions for data source connections. This enhances security by limiting the potential impact of a compromised account.
Capacity Planning: Estimate the expected concurrent users and refresh schedules to ensure adequate gateway capacity. Insufficient resources can lead to slow refresh times and poor report performance.
This approach is championed by the Microsoft Power BI infrastructure team and is essential for any organization utilizing on-premises data sources with Power BI. Proper gateway configuration and management ensure your reports are secure, performant, and always up-to-date, making it a best practice for leveraging the full power of Power BI in a hybrid environment.
8. Workspace Organization and Governance
A well-organized Power BI environment is crucial for any organization serious about data-driven decision making. Think of it like a well-maintained library: if books are scattered everywhere without a system, finding what you need becomes a nightmare. Workspace organization and governance provide the necessary structure and control to ensure your Power BI ecosystem remains scalable, maintainable, and secure. This practice allows everyone to easily find the data they need, while simultaneously safeguarding sensitive information.
Understanding Workspace Organization
Power BI workspaces serve as containers for reports, dashboards, datasets, and dataflows. A sound workspace strategy involves categorizing these workspaces based on factors like departments, projects, or data sensitivity. This allows for logical grouping of related content, improving discoverability and collaboration. This structured approach to organizing your workspaces will ensure that all content is appropriately categorized and accessible to authorized users.
For instance, you could have separate workspaces for Finance, Sales, and Marketing, each containing the relevant reports and datasets for their respective departments. Project-based workspaces can also be created for temporary initiatives, ensuring they don’t clutter the main workspaces after the project’s completion. Additionally, you could implement a tiered structure, with separate workspaces for Personal use, Team collaboration, Department-specific information, and Enterprise-wide datasets.
Why Governance Matters
Governance policies dictate who can access what data, and what they can do with it. This is crucial for protecting sensitive information and ensuring data integrity. Without proper governance, anyone could potentially modify critical datasets or share confidential reports, leading to chaos and inaccurate insights. Governance can enforce organizational standards like naming conventions and dataset certification, ensuring consistent and reliable data practices across the organization.
Actionable Tips for Workspace Management
Establish clear naming conventions: Consistent naming conventions make it easy to identify reports and datasets at a glance. For example, “Sales_Report_2024_Q1” is much clearer than “Report123.”
Create workspace templates: Templates for common scenarios like project workspaces can save time and ensure consistency in setup.
Implement regular workspace reviews: Periodic reviews help identify and remove obsolete or unused content, keeping your Power BI environment clean and tidy.
Use the Power BI Admin Portal: Leverage the admin portal for monitoring usage, managing permissions, and enforcing governance policies.
Document workspace purposes and data lineage: Clear documentation is essential for understanding how data flows through the system and who is responsible for it. Learn more about Workspace Organization and Governance for ideas on how AI and other automations can assist with optimizing workflows.
By implementing these practices, popularized by Microsoft’s documentation and supported by the Power BI community, you will improve the efficiency, security, and scalability of your Power BI solution. Well-defined governance and a clear workspace organization are key to making the most of “best practices power bi” and driving data-driven decision making throughout your organization. This best practice is crucial to success, especially as Power BI adoption expands across the organization. It provides a framework for effectively managing your data and ensures everyone can access the information they need in a secure and organized manner.
Best Practices Comparison of 8 Key Power BI Areas
Item
Implementation Complexity 🔄
Resource Requirements ⚡
Expected Outcomes 📊
Ideal Use Cases 💡
Key Advantages ⭐
Data Model Optimization and Star Schema Design
Moderate: requires upfront planning and ETL design
Moderate: design effort and data transformation
Improved query performance and maintainability
Enterprise reports needing clear data structure and fast queries
We’ve covered a lot of ground, exploring eight key best practices Power BI users can leverage to truly elevate their reporting game. From optimizing data models with star schemas to fine-tuning DAX expressions and implementing robust security measures, these strategies aren’t just nice-to-haves; they’re essential for building high-performing, reliable, and insightful Power BI solutions. Let’s recap the core takeaways and see how they fit into the bigger picture.
Key Takeaways and Their Impact
Remember, a well-structured data model is the foundation of any successful Power BI report. By implementing the star schema design, you’re ensuring optimal performance and making your data easier to understand and analyze. DAX optimization, combined with an incremental data refresh strategy, further boosts efficiency, delivering quicker insights without compromising accuracy.
Beyond performance, security is paramount. Row-Level Security (RLS) lets you control access to sensitive data, ensuring that only authorized personnel see the information relevant to their roles. Meanwhile, proper version control and workspace governance contribute to a smoother development lifecycle and promote collaborative teamwork. Finally, effectively managing your data gateway streamlines the flow of data into your reports, keeping everything up-to-date and readily available for analysis.
Actionable Next Steps
So, what’s next? Start by prioritizing the areas where you see the greatest potential for improvement. Perhaps your data model needs a revamp, or maybe your DAX expressions could use some fine-tuning. Focus on one area at a time, implement the suggested best practices, and observe the impact on your reports.
Experiment: Don’t be afraid to try different approaches and see what works best for your specific scenarios.
Iterate: Continuously refine your reports based on user feedback and evolving business needs.
Learn: The Power BI landscape is constantly evolving, so stay up-to-date with the latest features and best practices.
Unleashing the Power of Your Data
Mastering these best practices power bi allows you to transform raw data into actionable insights, empowering better decision-making across your organization. Think about it: faster reports, enhanced security, improved collaboration, and ultimately, a deeper understanding of your business. That’s the power of effective Power BI development.
Want to take your Power BI initiatives to the next level? NILG.AI offers expert guidance and tailored AI solutions to optimize your data analysis and drive business growth. Visit NILG.AI to learn how we can help you unlock the full potential of your data and transform your business intelligence strategies.
Master customer retention rate calculation with this practical guide. Learn the formulas, see real-world examples, and get actionable tips for business growth.
We use cookies on our website to give you the most relevant experience by remembering your preferences and repeat visits. By clicking “Accept All”, you consent to the use of ALL the cookies. However, you may visit "Cookie Settings" to provide a controlled consent.
This website uses cookies to improve your experience while you navigate through the website. Out of these, the cookies that are categorized as necessary are stored on your browser as they are essential for the working of basic functionalities of the website. We also use third-party cookies that help us analyze and understand how you use this website. These cookies will be stored in your browser only with your consent. You also have the option to opt-out of these cookies. But opting out of some of these cookies may affect your browsing experience.
Necessary cookies are absolutely essential for the website to function properly. These cookies ensure basic functionalities and security features of the website, anonymously.
Cookie
Duration
Description
cookielawinfo-checkbox-analytics
11 months
This cookie is set by GDPR Cookie Consent plugin. The cookie is used to store the user consent for the cookies in the category "Analytics".
cookielawinfo-checkbox-functional
11 months
The cookie is set by GDPR cookie consent to record the user consent for the cookies in the category "Functional".
cookielawinfo-checkbox-necessary
11 months
This cookie is set by GDPR Cookie Consent plugin. The cookies is used to store the user consent for the cookies in the category "Necessary".
cookielawinfo-checkbox-others
11 months
This cookie is set by GDPR Cookie Consent plugin. The cookie is used to store the user consent for the cookies in the category "Other.
cookielawinfo-checkbox-performance
11 months
This cookie is set by GDPR Cookie Consent plugin. The cookie is used to store the user consent for the cookies in the category "Performance".
viewed_cookie_policy
11 months
The cookie is set by the GDPR Cookie Consent plugin and is used to store whether or not user has consented to the use of cookies. It does not store any personal data.
Functional cookies help to perform certain functionalities like sharing the content of the website on social media platforms, collect feedbacks, and other third-party features.
Performance cookies are used to understand and analyze the key performance indexes of the website which helps in delivering a better user experience for the visitors.
Analytical cookies are used to understand how visitors interact with the website. These cookies help provide information on metrics the number of visitors, bounce rate, traffic source, etc.
Advertisement cookies are used to provide visitors with relevant ads and marketing campaigns. These cookies track visitors across websites and collect information to provide customized ads.