Welcome to the world of sales forecasting, where getting it right can mean the difference between scaling up and shutting down. It’s no secret that predicting future sales is part art, part science. But in today’s data-rich environment, relying solely on a gut feeling is like navigating a maze blindfolded. You might get lucky, but you’re more likely to hit a wall.
Accurate sales forecasting techniques are the bedrock of sound business strategy, influencing everything from inventory management and hiring plans to marketing budgets and revenue targets. Getting this right allows a business to allocate resources effectively, manage cash flow, and set realistic growth goals. For specialized business models, the approach can be even more nuanced. For a deeper dive into sector-specific approaches, you can explore this detailed article on SaaS forecasting to see how these principles are applied in a subscription-based context.
This guide is your detailed map to better predictions. We’re breaking down 10 powerful sales forecasting techniques, moving from trusted statistical methods like Regression and Time Series Analysis to more dynamic approaches like Machine Learning and Pipeline Forecasting.
We’ll explore the how-to, pros, cons, and real-world examples for each, giving you actionable insights to build forecasts you can actually count on. You’ll leave with a clear understanding of which methods fit your business model, data maturity, and strategic goals. No more guesswork, just a clear path to data-driven decisions. Let’s dive in.
1. Time Series Analysis
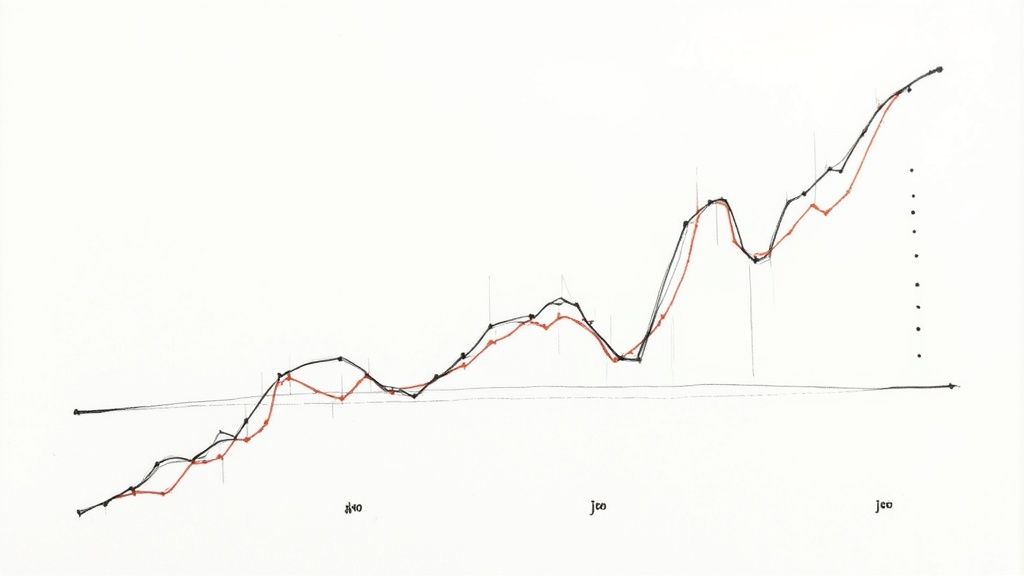
Kicking off our list is a classic and powerful statistical method: Time Series Analysis. Think of it as your business’s historian and fortune teller rolled into one. This technique involves analyzing historical sales data collected at regular intervals (like daily, weekly, or monthly) to spot patterns, trends, and seasonal variations. By understanding how your sales have behaved in the past, you can project those behaviors into the future.
The core idea is simple: the past holds clues to the future. It’s one of the most fundamental sales forecasting techniques because it relies on your own business data, making it highly relevant and accessible. Companies like Amazon and Coca-Cola use it extensively. Amazon relies on it for demand forecasting to manage their massive supply chain, while Coca-Cola uses seasonal models to predict beverage demand, ensuring you can always find a Coke when the weather heats up.
How to Make it Work for You
Ready to look into the past to predict your future? Here’s how to implement this method effectively.
Gather Enough Data: For this method to be reliable, you need a solid history. Aim for at least two to three years of consistent sales data. This gives the model enough information to identify recurring seasonal patterns and long-term trends accurately.
Clean Your Data: Raw data is rarely perfect. Before you start modeling, scrub your data by removing outliers or anomalies. Did a one-time viral marketing campaign cause a massive, unrepeatable sales spike? Account for it so it doesn’t skew your forecast.
Combine Models: Don’t just stick to one model. Techniques like the Holt-Winters method are great for data with trends and seasonality. You can often improve accuracy by combining the outputs of several different time series models.
Keep it Fresh: Your market isn’t static, and your model shouldn’t be either. Regularly update your model with the latest sales data to ensure your forecasts remain relevant and adapt to new market dynamics.
2. Pipeline Forecasting
Next up is a bottom-up method that gets right into the nitty-gritty of your sales cycle: Pipeline Forecasting. Instead of looking at broad historical trends, this technique zooms in on the individual deals currently moving through your sales pipeline. It’s like being the general on the battlefield, assessing the strength and position of each unit to predict the outcome of the war.
The core concept is to assign a probability of closing to each deal based on its stage in the sales process. A deal in the initial “discovery” phase might have a 10% chance, while one in the “negotiation” stage could have an 80% chance. Summing up these weighted values gives you a forecast grounded in your team’s current activities. This is one of the most popular sales forecasting techniques for B2B companies. For example, Salesforce reports a 27% improvement in forecast accuracy by using it, and HubSpot’s sales teams rely heavily on stage-based probabilities to guide their strategy.
How to Make it Work for You
Ready to turn your pipeline into a predictable revenue engine? Here’s how to implement this method effectively.
Establish Clear Stage Criteria: Your forecast is only as good as your pipeline’s integrity. Define exactly what needs to happen for a deal to move from one stage to the next. This ensures every rep evaluates opportunities consistently.
Use Historical Win Rates: Don’t just guess probabilities. Analyze your historical data to determine the actual win rate for deals at each stage. This data-driven approach removes bias and dramatically improves accuracy.
Conduct Regular Pipeline Reviews: Pipelines are dynamic. Hold weekly or bi-weekly meetings to review deals, clean up stale opportunities, and ensure stages and close dates are updated. This keeps your forecast from becoming a work of fiction.
Train Your Team: Accurate forecasting is a team sport. Train your sales reps on why accurate data entry matters and how to assess deal probabilities realistically. Their diligence is the foundation of a reliable forecast. You can also explore how machine learning for business analytics can enhance this process by identifying patterns your team might miss.
3. Regression Analysis
Next up is Regression Analysis, a statistical powerhouse among sales forecasting techniques. If Time Series Analysis is about understanding your sales over time, Regression Analysis is about understanding why your sales move the way they do. It works by identifying and quantifying the relationship between your sales (the dependent variable) and various influential factors (the independent variables) like marketing spend, competitor pricing, or even economic trends.
The central idea is to create a mathematical equation that predicts future sales based on the expected values of these drivers. It’s a step beyond just looking at past sales; it’s about understanding the cause-and-effect dynamics of your market. Major companies lean on this heavily. P&G uses regression to connect advertising spend with sales volume, while Netflix employs complex multiple regression models to forecast subscriber growth based on content investment, pricing, and regional market penetration.
How to Make it Work for You
Want to uncover the hidden drivers behind your sales figures? Here’s how you can effectively use Regression Analysis.
Start Simple, Then Scale: Don’t jump into a model with dozens of variables. Begin with simple linear regression, testing one independent variable (like ad spend) against sales. This helps you understand the core relationship before adding more complexity with multiple regression.
Validate Your Model: A model that perfectly explains past data isn’t useful if it can’t predict the future. Test your model’s predictive power using out-of-sample data, which is data it hasn’t seen during its training. This confirms its real-world accuracy.
Check Your Variables: The relationships between variables can change over time. What drove sales last year might not be as impactful this year. Regularly re-test your variables to ensure they are still statistically significant and update your model accordingly.
Look for Interactions: Sometimes, the whole is greater than the sum of its parts. Consider interaction effects. For example, your marketing campaigns might be significantly more effective during a specific season. A good model accounts for these combined impacts.
4. Machine Learning Forecasting
Stepping into the future of sales forecasting techniques, we have Machine Learning. This advanced method uses artificial intelligence to sift through vast datasets and uncover complex patterns that simpler statistical models might miss. Think of it as a super-powered analyst that continuously learns from new data, improving its predictions over time.
Unlike traditional methods that follow programmed rules, machine learning models adapt on their own. For a deeper understanding of the core concepts behind this powerful method, you can explore the principles of Machine Learning (ML). Tech giants like Amazon use it to forecast demand for millions of products, while Uber leverages it for dynamic pricing and predicting ride demand. Fashion retailer Zara even uses it to forecast fast-moving trends and optimize inventory, ensuring the right styles hit the stores at the right time. Curious about how this can transform your operations? You can see how machine learning can revolutionize your business.
How to Make it Work for You
Ready to empower your forecasting with AI? Here’s how to get started with machine learning.
Start Simple, Scale Up: Don’t jump straight to the most complex neural network. Begin with simpler, more interpretable algorithms like linear regression or random forests. Get comfortable with the process and results before moving on to more sophisticated models.
Prioritize Data Quality: Machine learning is powerful, but it’s not magic. Its predictions are only as good as the data it’s trained on. Ensure you have high-quality, clean, and relevant training data. Garbage in, garbage out is the golden rule here.
Validate and Avoid Overfitting: Use techniques like cross-validation to test your model’s performance on unseen data. This helps prevent “overfitting,” a common pitfall where the model performs perfectly on training data but fails to generalize to new, real-world scenarios.
Combine Models for Strength: The “ensemble method” involves combining the predictions from multiple different models. This approach often leads to more robust and accurate forecasts than relying on a single algorithm, leveraging the strengths of each.
5. Opportunity Stage Forecasting
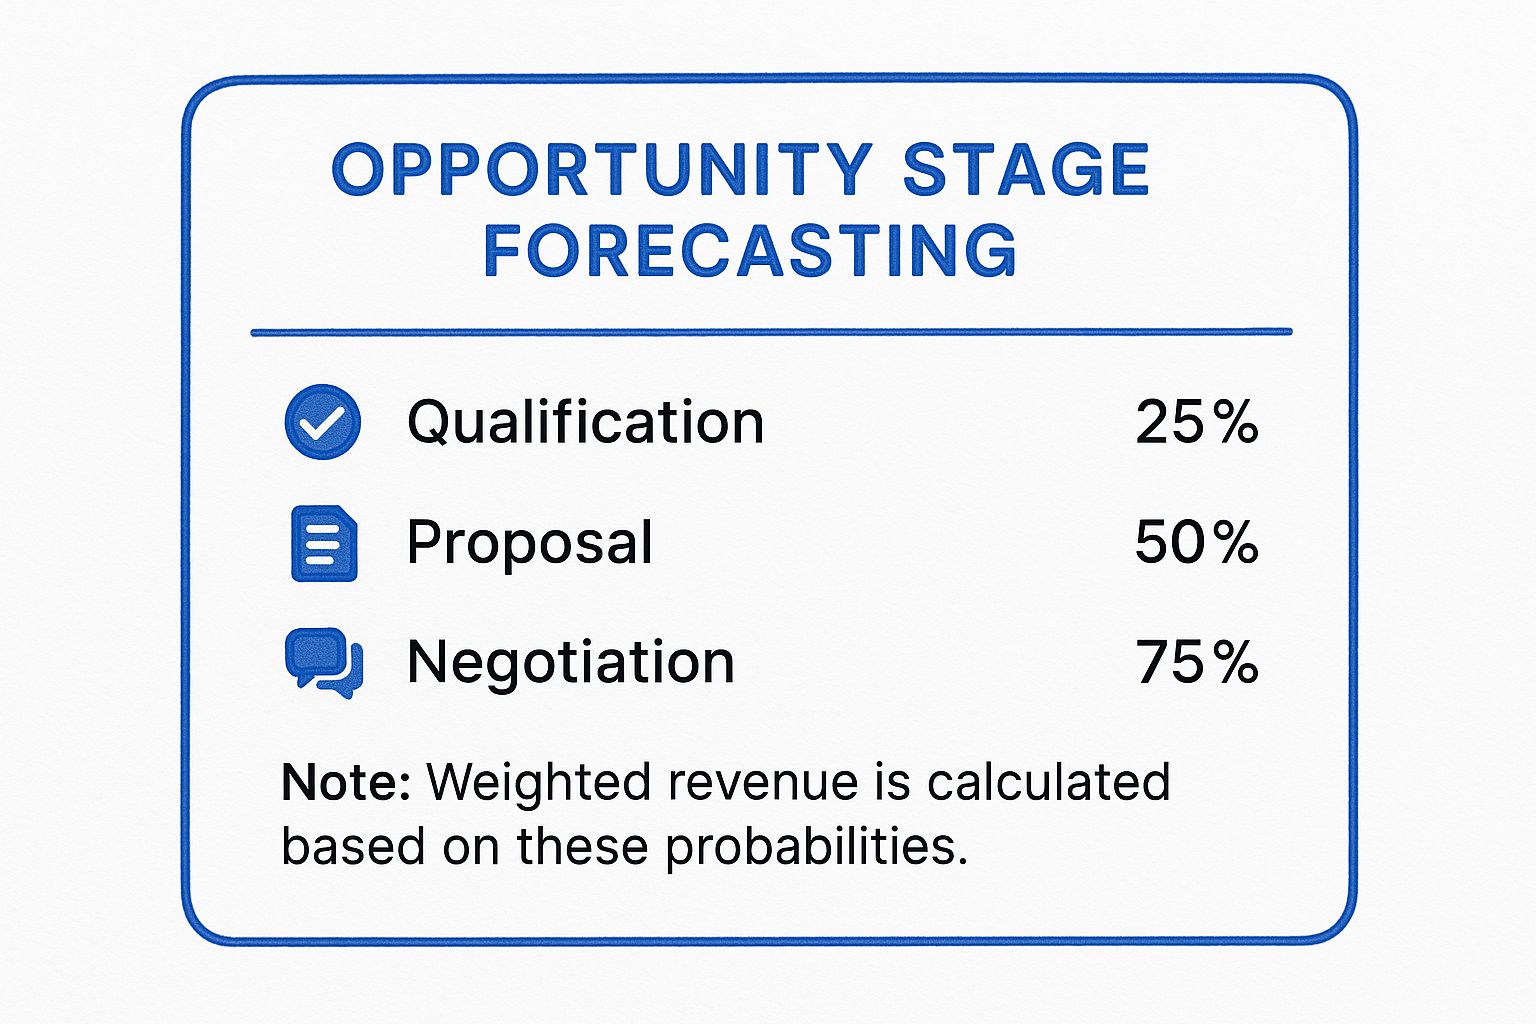
Next, we have a technique that brings much-needed structure and objectivity to your sales pipeline: Opportunity Stage Forecasting. This method involves breaking down your sales process into distinct stages and assigning a specific probability of closing to each one. As a deal moves from an initial lead to a closed-won customer, its probability increases, giving you a weighted forecast based on real progress.
This structured approach transforms forecasting from a guessing game into a methodical process. It forces your sales team to think critically about where each deal truly is in the buyer’s journey. Companies like IBM and SAP have championed this model. IBM, for example, uses a meticulous 7-stage process, while SAP enhances its stage-based forecasts with AI to achieve even greater accuracy. It’s one of the most popular sales forecasting techniques for B2B companies with longer sales cycles.
Here’s a quick reference for how a typical three-stage pipeline might look, showing how the probability increases as the deal progresses.
The visualization shows how a deal’s value to the forecast grows as it moves through key milestones, from proposal to negotiation.
How to Make it Work for You
Ready to bring discipline to your pipeline? Here’s how to implement opportunity stage forecasting and get reliable results.
Define Clear Stage Criteria: Your stages must be based on tangible, verifiable customer actions, not just a rep’s gut feeling. For a deal to move from “Proposal” to “Negotiation,” for example, require that the customer has provided written feedback on the proposal. This removes ambiguity.
Use Historical Data to Set Probabilities: Don’t just pick percentages out of thin air. Analyze your historical data to see the actual conversion rates from one stage to the next. If 50% of deals that reach the proposal stage historically close, then 50% is your starting probability.
Train Your Team Rigorously: Everyone on the sales team must understand and apply the stage definitions consistently. Regular training and reinforcement are crucial to prevent “pipeline padding,” where deals are advanced prematurely to look better.
Review and Calibrate Regularly: Your sales process and customer behavior will evolve. Review your stage definitions and probabilities quarterly or semi-annually. If you notice conversion rates are changing, adjust your model accordingly to maintain accuracy.
6. Leading Indicators Analysis
If time series analysis is like looking in the rearview mirror, Leading Indicators Analysis is like looking at the road ahead through your windshield. This proactive forecasting technique involves tracking metrics that provide an early warning system for future sales. Instead of waiting for revenue numbers, you analyze activities that historically correlate with sales, giving you a head start on trends.
The premise is that certain actions today reliably predict sales outcomes tomorrow. For instance, HubSpot famously tracks marketing qualified leads (MQLs) as a key predictor of future growth. Similarly, Salesforce monitors trial sign-ups to forecast subscription revenue. Beyond internal data, external factors and market indicators are crucial. For instance, understanding effective B2B lead generation strategies can help you identify which external marketing channels are most likely to produce high-quality leading indicators for your pipeline.
How to Make it Work for You
Want to build your own sales early-warning system? Here’s how to put this forward-looking sales forecasting technique into practice.
Find Your Predictors: Don’t just guess. Test multiple potential indicators like website traffic, demo requests, or proposal submissions to see which ones have the strongest statistical correlation with your actual sales data.
Establish the Time Lag: A new lead today won’t become a sale tomorrow. Analyze historical data to determine the average time it takes for an indicator (like a trial sign-up) to convert into a closed deal. This time lag is essential for accurate forecasting.
Combine and Conquer: Relying on a single indicator can be risky. A more robust approach combines several leading indicators. For example, you might blend MQL volume with demo completion rates and proposal submission numbers for a more balanced and reliable forecast.
Validate and Re-validate: The market changes, and so does customer behavior. What worked as a reliable indicator last year might not be as predictive today. Regularly review and validate the correlation between your chosen indicators and sales performance to ensure they remain relevant.
7. Multivariable Analysis
Moving beyond single-variable methods, we have Multivariable Analysis, a powerful statistical approach that embraces the complexity of the real world. This technique doesn’t just look at past sales in isolation; it examines how multiple internal and external factors work together to influence your sales performance. Think of it as connecting the dots between your marketing spend, competitor pricing, economic trends, and even the weather to build a richer, more nuanced forecast.
The core principle here is that sales are rarely driven by just one thing. This is one of the more advanced sales forecasting techniques because it acknowledges that your business operates in a dynamic ecosystem. For example, Tesla uses it to factor in economic indicators, government policy changes, and competitor product launches into its delivery forecasts. Similarly, Procter & Gamble analyzes a mix of variables like ad spend, promotional activities, and retail placements to predict brand performance.
How to Make it Work for You
Ready to build a more comprehensive picture of your sales drivers? Here’s how you can effectively implement Multivariable Analysis.
Start with Key Drivers: Don’t try to model everything at once. Begin by identifying the two or three variables you believe have the most significant impact on your sales. You can add more complexity later as you refine the model.
Check for Correlation: Before finalizing your variables, use correlation analysis to ensure they aren’t redundant. For instance, if marketing spend and website traffic are almost perfectly correlated, including both might not add new predictive power and could complicate the model.
Test Your Assumptions: The relationships between variables can change. Regularly test your model’s assumptions to confirm they still hold true. Did a recent market shift change how customers respond to your pricing? Your model needs to reflect that. The construction industry, for example, uses this to handle complex, interrelated product demands. You can learn more about its application in multiple product forecasting.
Document Everything: Keep a clear record of your variable definitions, data sources, and any transformations you apply. This makes your model transparent, easier to troubleshoot, and simpler to hand over to other team members.
8. Length of Sales Cycle Analysis
Timing is everything in sales, and this next method is all about mastering it. Length of Sales Cycle Analysis is a powerful technique that shifts the focus from if a deal will close to when it will close. It involves digging into your historical data to understand the average time it takes for a lead to journey through your entire sales pipeline, from initial contact to a signed contract. By knowing your typical sales cycle duration, you can make much more accurate predictions about future revenue timing.
This method helps you move beyond gut feelings and apply a data-driven lens to your pipeline. It’s one of the most practical sales forecasting techniques because it directly answers the crucial question of cash flow timing. Major B2B players like Salesforce and Oracle live by this analysis. Salesforce uses it to help its own customers predict quarterly performance, while Oracle relies on it to forecast revenue timing for large enterprise deals, which often have long and complex cycles.
How to Make it Work for You
Ready to become a master of sales timing? Here’s how to put this powerful technique into practice.
Segment Your Analysis: Not all deals are created equal. A $5,000 deal will close much faster than a $500,000 enterprise contract. Segment your cycle analysis by lead source, deal size, industry, or product line to uncover more accurate and actionable insights.
Track Average and Median Times: The average (mean) cycle time can be skewed by a few unusually long or short deals. Also, track the median time, which gives you a better sense of the “typical” sales cycle by finding the middle value.
Identify Bottlenecks and Accelerators: Use the data to pinpoint what slows deals down (e.g., legal review) and what speeds them up (e.g., a specific demo script). Addressing these factors can shorten your overall sales cycle and improve forecast accuracy.
Update Your Benchmarks: Your sales process evolves, and so should your benchmarks. Regularly refresh your sales cycle data with new closed deals to ensure your forecasts are based on the most current business reality.
9. Intuitive/Judgmental Forecasting
Sometimes, the best forecasting tool isn’t a complex algorithm but the human mind. Intuitive or Judgmental Forecasting is a qualitative method that leans on the experience, gut feelings, and deep industry knowledge of sales professionals, managers, and experts. It’s about tapping into the wisdom that can’t be easily quantified, making it one of the most essential sales forecasting techniques when data is scarce or the market is in flux.
This approach is invaluable in situations where historical data is irrelevant or nonexistent. Think of a startup launching a groundbreaking product; there’s no past data to analyze. Similarly, pharmaceutical companies rely on expert judgment to predict sales for a new drug, factoring in physician adoption rates and competitive responses. The core idea is that seasoned experts can often spot nuances and predict market shifts that data alone would miss.
How to Make it Work for You
Ready to trust your team’s expertise? Here’s how to structure this human-centric method for better accuracy.
Combine Multiple Opinions: Relying on one person’s intuition can be risky due to individual bias. Instead, gather insights from a diverse group of experts, including sales reps on the ground, senior managers, and even external consultants. This helps create a more balanced and reliable forecast.
Document Your Assumptions: Don’t let intuition be a black box. Require everyone to clearly document the “why” behind their predictions. What market trends, competitor actions, or customer behaviors are influencing their forecast? This makes the process transparent and easier to review later.
Use a Structured Framework: To avoid chaotic brainstorming sessions, use a structured approach like the Delphi method. This involves anonymously surveying a panel of experts over several rounds, sharing summarized results between rounds to help the group move toward a consensus without being swayed by dominant personalities.
Track and Refine: Treat your intuitive forecasts like any other model. Regularly compare the predictions against actual sales results. This feedback loop helps your team refine their judgment over time, making their future intuitive forecasts even more accurate.
10. Test-Market Analysis
Want to predict how a new product or campaign will perform without betting the entire farm? Test-Market Analysis is your crystal ball. This technique involves launching a product or marketing initiative in a limited, controlled geographic area or to a specific customer segment to gather real-world data. It’s like a dress rehearsal for your big launch, letting you measure actual customer behavior instead of just relying on surveys or historical data.
The beauty of this method lies in its real-world accuracy. By observing how actual consumers react, you can generate a highly reliable forecast for a wider rollout. McDonald’s famously uses this method to test new menu items like the McRib in select cities before deciding on a national launch. Similarly, Procter & Gamble often introduces new consumer goods in specific regions to gauge demand and refine their marketing strategy, making this one of the most practical sales forecasting techniques for new ventures.
How to Make it Work for You
Ready to run a real-world experiment? Here’s how to effectively use Test-Market Analysis for more accurate sales forecasting.
Choose Representative Markets: Your test market should be a microcosm of your broader target audience. Select a region or demographic group that mirrors the characteristics of the larger market you plan to enter. This ensures your results are scalable and not just a local fluke.
Establish Clear Metrics: Before you launch, define what success looks like. Are you measuring initial sales, repeat purchases, customer acquisition cost, or market share? Having clear, predetermined key performance indicators (KPIs) is crucial for evaluating the test’s outcome objectively.
Control External Factors: Try to isolate the test from external noise. Be aware of competitor promotions, local economic events, or other variables that could skew your results. A controlled environment gives you a cleaner read on your product’s inherent potential.
Run a Sufficiently Long Test: Don’t pull the plug too early. A test needs to run long enough to move beyond the initial launch hype and capture more typical buying cycles, including repeat purchases. This helps you understand the true, sustainable demand.
Sales Forecasting Techniques Comparison
Forecasting Method
Implementation Complexity 🔄
Resource Requirements ⚡
Expected Outcomes 📊
Ideal Use Cases 💡
Key Advantages ⭐
Time Series Analysis
Moderate; relies on historical data and statistical models
Moderate; requires 2-3+ years of data
Accurate short to medium-term forecasts of sales trends
Businesses with consistent sales patterns and seasonal demand
High accuracy with stable data; identifies trends and seasonality
Pipeline Forecasting
Moderate to high; needs detailed pipeline data and CRM integration
Low; depends on expert opinion and qualitative inputs
Low; relies on human expertise
Flexible, experience-based forecasts
Limited data environments; markets with rapid changes
Quick to deploy; accounts for unprecedented conditions
Test-Market Analysis
High; requires controlled experiments and pilot tests
High; time-consuming and costly
Real-world validated forecasts before full launch
New product launches and market expansions
Reduces risk; provides actual performance data
Choosing Your Forecasting Toolkit: The Hybrid Approach
We’ve just navigated a comprehensive landscape of sales forecasting techniques, exploring everything from the mathematical rigor of Time Series and Regression Analysis to the intuitive wisdom of Judgmental Forecasting. We’ve seen how Pipeline Forecasting gives you a real-time snapshot of your deal flow, while Machine Learning offers a glimpse into a future shaped by complex, interwoven variables. If you walk away with one single insight, let it be this: the “silver bullet” of forecasting doesn’t exist.
The most resilient and accurate sales forecasts aren’t built on a single pillar. Instead, they are sophisticated structures, architected by combining multiple methods into a powerful hybrid model. True forecasting mastery lies in knowing which techniques to blend, and when.
The Power of the Hybrid Model
Think of each forecasting technique as a unique instrument in an orchestra. Time Series Analysis might be your steady, reliable percussion section, laying down the rhythm of historical sales data. Regression Analysis adds the strings, introducing the nuance of external factors like market trends or ad spend. Your sales team’s gut feeling, captured through Intuitive Forecasting, is the improvisational solo that accounts for the human element no algorithm can fully grasp.
A B2B enterprise tech company, for instance, can achieve incredible foresight by layering these methods:
For short-term (quarterly) planning: They might rely heavily on Opportunity Stage Forecasting, weighting deals based on their progress through the sales funnel. This provides a granular, bottom-up view of what’s likely to close.
For medium-term (annual) strategy: They could overlay this with Length of Sales Cycle Analysis to predict cash flow and resource allocation, ensuring they have the right staff in place to manage the projected deal velocity.
For long-term (3-5 year) vision:Multivariable or Regression Analysis becomes critical. This is where they zoom out and factor in macroeconomic indicators, competitor actions, and planned product launches to chart a course for sustainable growth.
This layered approach smooths out the weaknesses inherent in any single method. Your quantitative models provide an objective baseline, while qualitative insights from your team can correct for anomalies, like that one massive, unexpected deal that could skew your entire forecast.
Your Action Plan: Moving from Theory to Practice
So, how do you start building your own hybrid forecasting engine? It’s an iterative process, not a one-time setup. Here are your next steps:
Conduct a Data and Skills Audit: What data do you have access to right now? Is it clean and organized? Do you have years of historical sales data for Time Series, or is your CRM a treasure trove of pipeline data? Equally important, what skills exist on your team? Do you have data analysts who can run regression models, or will you start with simpler spreadsheet-based methods?
Start Simple and Layer Up: Don’t try to implement five new sales forecasting techniques at once. Begin with a foundational model, like Pipeline Forecasting, which is often readily available from your CRM. Once you have a baseline, experiment by adding a second layer. For example, use Leading Indicators Analysis to see if website traffic spikes or demo requests correlate with future sales, giving you an early warning system.
Create a Feedback Loop: Your forecast is a living document, not a stone tablet. Regularly compare your predictions to actual results. Where were you off? Was it because a major deal slipped? Or did an external event, like a competitor’s product launch, impact your market? Use these insights to continuously refine your model.
Key Insight: The goal isn’t just to predict the future; it’s to understand the drivers behind that future. A great forecast tells you not only what will happen but why it will happen, empowering you to take proactive steps to influence the outcome.
By mastering these concepts, you transform forecasting from a stressful, crystal-ball gazing exercise into one of your most powerful strategic advantages. You move from reacting to monthly numbers to proactively shaping them, making smarter decisions about hiring, inventory, marketing spend, and overall business strategy. Your forecast becomes the central nervous system of your growth engine, providing the clarity and confidence needed to navigate any market condition.
Ready to move beyond spreadsheets and build a truly dynamic forecasting system? NILG.AI specializes in developing custom AI and machine learning solutions that integrate multiple sales forecasting techniques into a single, intelligent engine. We help you unlock the predictive power of your data, turning historical trends and real-time inputs into your greatest strategic asset.
Explore how NILG.AI can build a tailored forecasting model for your business.
Master customer retention rate calculation with this practical guide. Learn the formulas, see real-world examples, and get actionable tips for business growth.
We use cookies on our website to give you the most relevant experience by remembering your preferences and repeat visits. By clicking “Accept All”, you consent to the use of ALL the cookies. However, you may visit "Cookie Settings" to provide a controlled consent.
This website uses cookies to improve your experience while you navigate through the website. Out of these, the cookies that are categorized as necessary are stored on your browser as they are essential for the working of basic functionalities of the website. We also use third-party cookies that help us analyze and understand how you use this website. These cookies will be stored in your browser only with your consent. You also have the option to opt-out of these cookies. But opting out of some of these cookies may affect your browsing experience.
Necessary cookies are absolutely essential for the website to function properly. These cookies ensure basic functionalities and security features of the website, anonymously.
Cookie
Duration
Description
cookielawinfo-checkbox-analytics
11 months
This cookie is set by GDPR Cookie Consent plugin. The cookie is used to store the user consent for the cookies in the category "Analytics".
cookielawinfo-checkbox-functional
11 months
The cookie is set by GDPR cookie consent to record the user consent for the cookies in the category "Functional".
cookielawinfo-checkbox-necessary
11 months
This cookie is set by GDPR Cookie Consent plugin. The cookies is used to store the user consent for the cookies in the category "Necessary".
cookielawinfo-checkbox-others
11 months
This cookie is set by GDPR Cookie Consent plugin. The cookie is used to store the user consent for the cookies in the category "Other.
cookielawinfo-checkbox-performance
11 months
This cookie is set by GDPR Cookie Consent plugin. The cookie is used to store the user consent for the cookies in the category "Performance".
viewed_cookie_policy
11 months
The cookie is set by the GDPR Cookie Consent plugin and is used to store whether or not user has consented to the use of cookies. It does not store any personal data.
Functional cookies help to perform certain functionalities like sharing the content of the website on social media platforms, collect feedbacks, and other third-party features.
Performance cookies are used to understand and analyze the key performance indexes of the website which helps in delivering a better user experience for the visitors.
Analytical cookies are used to understand how visitors interact with the website. These cookies help provide information on metrics the number of visitors, bounce rate, traffic source, etc.
Advertisement cookies are used to provide visitors with relevant ads and marketing campaigns. These cookies track visitors across websites and collect information to provide customized ads.