In 2025, data is the key to smart decisions. This listicle spotlights eight leading analytic data solutions—Tableau, Microsoft Power BI, Google BigQuery, Amazon Redshift, Snowflake, Apache Spark, SAS Analytics, and Databricks—to help your business thrive. We'll show you how these platforms transform raw data into actionable insights, giving you a competitive edge. Whether you're an executive, data scientist, or entrepreneur, discover the power of these analytic data solutions to drive better results. NILG.AI specializes in leveraging these tools for effective business solutions, navigating the complexities of data-driven decision making.
1. Tableau
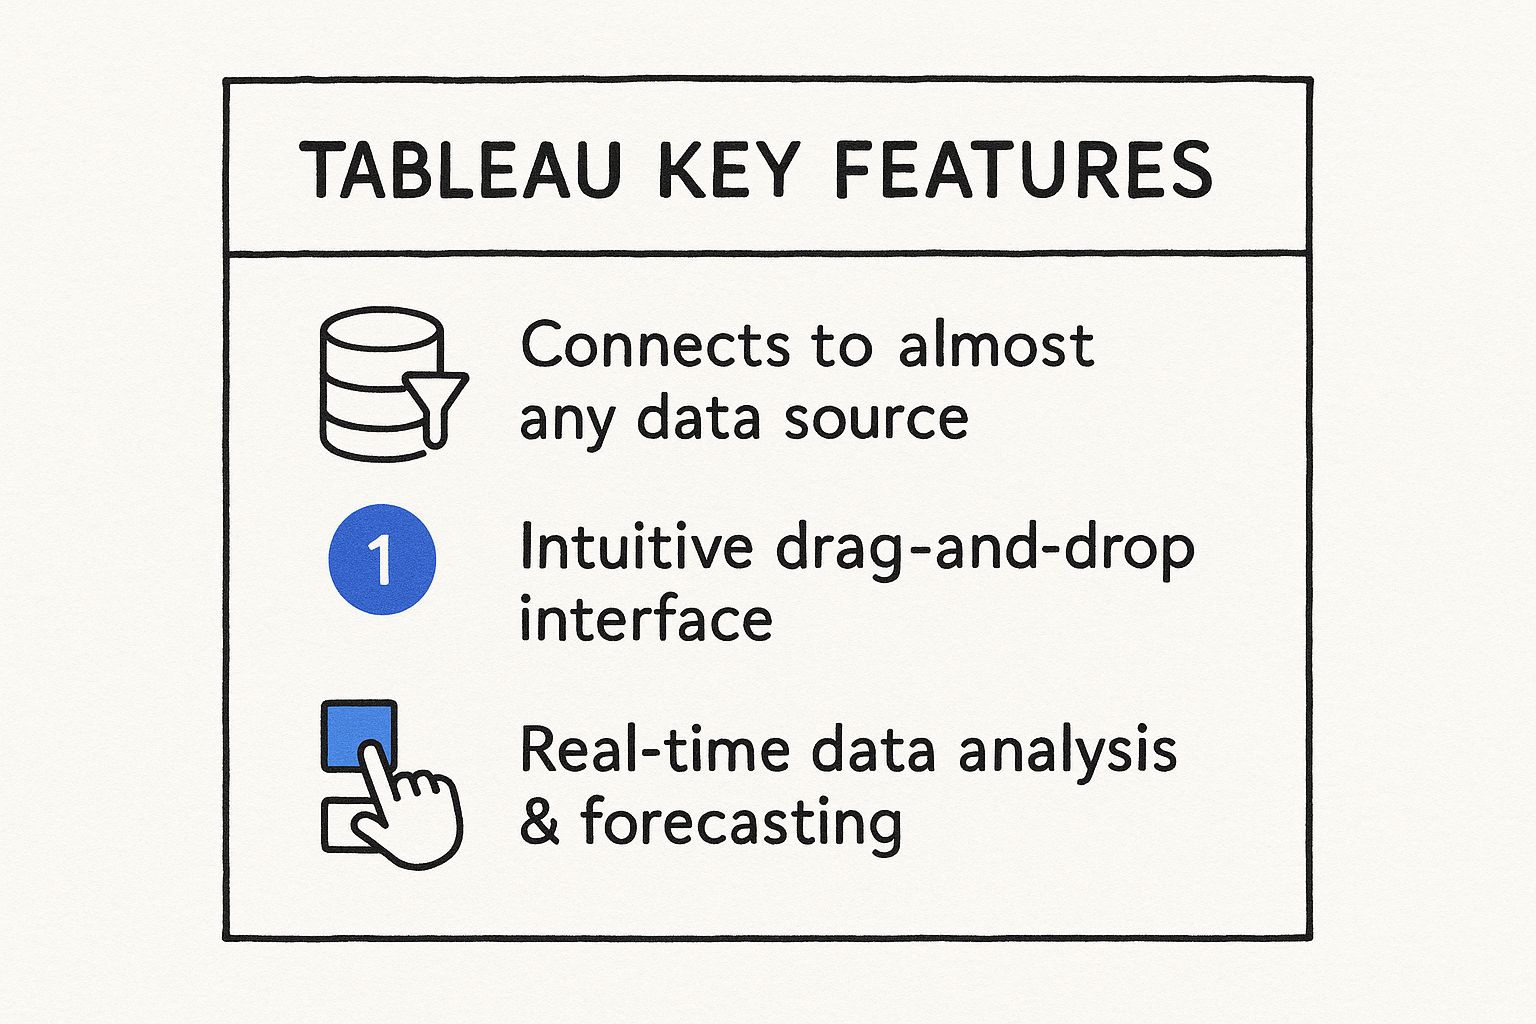
Looking for a robust analytic data solution that doesn't require a PhD in data science? Tableau might be just what you need. It's a leading business intelligence and data visualization platform that makes turning raw data into understandable, actionable insights a breeze. Whether you're connecting to a spreadsheet or a massive database, Tableau's intuitive drag-and-drop interface lets you create interactive dashboards, reports, and visualizations that tell a story. It empowers users of all technical skill levels to explore data, identify trends, and make informed decisions.
The infographic above provides a quick reference for some of Tableau's key strengths: its intuitive interface, powerful visualization capabilities, and broad applicability across various business functions. This combination of ease of use and robust functionality is a major reason why Tableau is such a popular choice for analytic data solutions.
So, how does it actually work? Tableau connects to almost any data source imaginable – from Excel files and cloud databases to data warehouses and big data platforms. Once connected, you can use its drag-and-drop interface to build interactive visualizations. Want to see sales performance by region? Drag "Sales" to the rows and "Region" to the columns. Need to filter data by date? Just drag "Date" to the filters shelf. It's that simple. Beyond basic charting, Tableau offers advanced analytics features like forecasting, statistical modeling, and real-time data analysis, enabling deeper dives into your data.
Here’s a quick summary of key takeaways regarding Tableau:
User-Friendly: Drag-and-drop interface makes data analysis accessible to everyone.
Visually Powerful: Creates interactive and compelling dashboards that communicate insights effectively.
Versatile: Connects to various data sources and supports advanced analytics.
Scalable: Suitable for businesses of all sizes, from startups to large enterprises.
This combination of ease of use and analytical power is why Tableau stands out as a top analytic data solution.
But don't just take our word for it. Companies like Coca-Cola, JPMorgan Chase, and Pfizer use Tableau for everything from streamlining supply chain analytics to monitoring financial risk and accelerating clinical trial data analysis. These examples highlight Tableau's versatility and impact across diverse industries.
The video above offers a more visual introduction to Tableau and its capabilities.
As the infographic visually summarizes, Tableau’s intuitive nature makes it easy to learn and use, its visualization power helps to bring data to life, and its flexibility is a key strength as it connects to a multitude of data sources.
Thinking about giving Tableau a try? Here are a few tips: Start with pre-built templates to get up and running quickly. Use Tableau Prep for cleaning and preparing your data. Plan your data governance strategy early on. And, if you're working with large datasets, be mindful of performance optimization techniques. Tableau also offers excellent training resources and certification programs to help you maximize its potential.
Pros: Tableau's highly intuitive interface requires minimal technical skills. It offers impressive visualization capabilities with tons of customization options. It’s backed by a robust community and tons of learning resources. Plus, it integrates seamlessly with a wide variety of data sources and receives regular updates with new features.
Cons: It's pricier than some competitors. Performance can lag with extremely large datasets. For very specialized statistical analysis, you might need a dedicated statistical tool. And while generally user-friendly, some advanced features do have a learning curve.
Tableau deserves its spot on this list because it offers a compelling balance of power and usability. It empowers everyone, from business executives to data scientists, to unlock the potential of their data. Whether you need to create a quick sales report or build a complex interactive dashboard, Tableau provides the tools you need to explore, understand, and communicate data effectively. You can explore more about Tableau on the official Tableau website.
2. Microsoft Power BI
Looking for a powerful analytic data solution that won't break the bank? Microsoft Power BI might be just what you need. It's a business analytics service designed to give you the insights you need to make quick, informed decisions. Think of it as transforming raw data into visually engaging and interactive dashboards that tell a story. What's really cool is how seamlessly it integrates with other Microsoft products, making it a natural choice if you're already invested in that ecosystem. Power BI offers both self-service options for individual users and robust enterprise-grade features for larger organizations, accessible via desktop, cloud, and mobile apps.
Power BI lets you connect to and model data from a wide range of sources, map relationships between different datasets, and build interactive visualizations to explore trends and patterns. Its natural language query feature (called Q&A) even lets you ask questions in plain English and get instant answers in visual form. Plus, AI-powered insights and visualizations can surface hidden trends you might otherwise miss. Learn more about Microsoft Power BI and how it facilitates data-driven decision making.
Real-world examples demonstrate Power BI's impact: Adobe uses it to analyze customer engagement, Heathrow Airport leverages it to optimize passenger flow, and Novartis employs it to transform clinical trial reporting. These examples show how adaptable and powerful Power BI can be across different industries.
Here's why Power BI deserves a spot on this list: It offers a compelling combination of cost-effectiveness, deep integration with the Microsoft ecosystem (think Excel, Azure, and Dynamics 365), and a powerful language called DAX (Data Analysis Expressions) for complex calculations. Microsoft also rolls out regular monthly updates with new features and functionalities, keeping the platform fresh and continuously improving. Security is a priority too, with strong built-in features and numerous compliance certifications.
Features you'll love:
Data modeling and relationship mapping
Natural language query (Q&A)
AI-powered insights and visualizations
Seamless Microsoft product integration
Custom visualization creation
Real-time streaming data analysis
Row-level security and governance
Pros:
Cost-effective compared to competitors
Deep Microsoft ecosystem integration
Powerful DAX language
Regular updates
Robust security
Cons:
Complex data modeling may require learning DAX
Visualization options can be less extensive than some competitors
Performance can degrade with very large datasets
Desktop version is Windows-only
Tips to make the most of Power BI:
Use Power Query to clean and prep your data before visualizing.
Implement incremental refresh for large datasets to boost performance.
Utilize bookmarks and drillthrough features for interactive reporting.
Configure your gateway properly for on-premises data sources.
Don’t forget those AI-powered visuals for automated insights!
Power BI is a game-changer for anyone looking to turn data into actionable insights. Whether you're a business executive, data scientist, operations manager, or entrepreneur, Power BI empowers you to explore your data, uncover hidden trends, and make smarter decisions.
3. Google BigQuery: Your Serverless Data Warehouse Powerhouse
Need to wrestle with petabytes of data? Google BigQuery might just be your analytic data solution. This fully-managed, serverless data warehouse lets you scale your analysis efforts like never before, making it a top contender in the world of big data. As a Platform as a Service (PaaS), you can ditch the server management headaches and focus on what matters: extracting insights from your data.
BigQuery’s magic lies in its ability to handle massive datasets with impressive speed and efficiency. It uses ANSI SQL, a familiar language for many data professionals, and even boasts built-in machine learning capabilities. Imagine querying massive datasets in real-time without breaking the bank – that’s the promise of BigQuery. It achieves this through a combination of high-performance, cost-effective storage and the ability to seamlessly join datasets from various sources.
Here’s a breakdown of what makes BigQuery tick:
Serverless Architecture & Auto-Scaling: Forget about provisioning servers; BigQuery automatically scales to meet your needs. This is a game-changer, especially for businesses experiencing fluctuating data volumes.
Real-Time Analytics: Analyze streaming data as it arrives, enabling you to react to trends and events as they unfold.
Geospatial Analysis: Unlock insights from location-based data with BigQuery's powerful geospatial capabilities.
BigQuery ML: Build and deploy machine learning models directly within BigQuery, simplifying the process and reducing data movement.
BI Engine: Experience sub-second query responses, making interactive dashboards and reporting a breeze.
Multi-Region Replication: Ensure data availability and disaster recovery with robust multi-region replication.
Security Features: Leverage column-level security and dynamic data masking to protect sensitive information.
Why BigQuery Deserves Its Spot on the List:
BigQuery offers a potent mix of scalability, cost-effectiveness (with its pay-per-query pricing), and ease of use. This makes it ideal for organizations of all sizes, from startups to Fortune 500 companies. The seamless integration with the broader Google Cloud ecosystem is a major plus for those already invested in Google's cloud services. You can even query external data sources directly, further streamlining your data pipelines.
Pros:
Exceptional Scalability: Handle petabyte-scale datasets without breaking a sweat.
Pay-Per-Query Pricing: Only pay for the queries you run, making it cost-effective for occasional analysis.
Zero Infrastructure Management: Focus on insights, not server maintenance.
Seamless Google Cloud Integration: Easily integrate with other Google Cloud services.
Query External Data Sources: Access and analyze data from various sources directly.
Cons:
Cost Escalation: Costs can rise quickly with complex and large-scale queries.
Optimization Learning Curve: Mastering query optimization is crucial for cost control and performance.
Limited Stored Procedures: Fewer stored procedure options compared to traditional databases.
SQL Syntax Differences: Some variations in SQL syntax might require adjustments for those accustomed to other implementations.
Real-World Success Stories:
BigQuery is powering data analytics at some of the world's leading companies:
Twitter: Processes hundreds of petabytes of data for advertising analytics.
Spotify: Analyzes listening patterns across its vast user base.
The New York Times: Leverages BigQuery to personalize content recommendations.
Actionable Tips:
Partitioning & Clustering: Optimize query performance and cost by partitioning and clustering your tables.
Cost Controls: Implement quotas and budgets to prevent unexpected expenses.
Materialized Views: Pre-compute and store query results for frequently accessed data.
BI Engine: Use BI Engine for interactive dashboarding and reporting workloads.
Schema Design: Implement the correct data types and schema design for optimal storage and query performance.
When and Why to Use BigQuery:
BigQuery shines when dealing with large datasets, complex analytical queries, and real-time data analysis. It's a perfect fit for businesses needing a scalable, cost-effective, and easy-to-manage data warehouse solution. If you're looking to unlock the power of your data without the hassle of managing complex infrastructure, BigQuery is worth serious consideration.
For a deeper dive into how BigQuery is used in real-world applications, you might find this insightful: Learn more about Google BigQuery.
BigQuery, as a key analytic data solution, empowers organizations to derive actionable insights from their data, regardless of its size and complexity. Its serverless architecture, combined with powerful features and seamless integration with the Google Cloud ecosystem, makes it a valuable tool for any data-driven organization.
4. Amazon Redshift: Your Data Warehouse Powerhouse in the Cloud
Dealing with massive datasets and need to extract valuable insights? Amazon Redshift might be just the analytic data solution you're looking for. This fully managed, petabyte-scale data warehouse service lives in the cloud and is designed to crunch massive numbers using standard SQL and your existing business intelligence tools. Think of it as a turbocharged engine for your data analysis, capable of handling both structured and semi-structured data from various sources like your data warehouses, operational databases, and even data lakes.
How It Works: Under the Hood of Redshift
Redshift's secret sauce is its Massively Parallel Processing (MPP) architecture. Imagine a team of chefs working together to prepare a complex dish – that's MPP in action. It distributes data and queries across multiple nodes, allowing for lightning-fast processing. This is further enhanced by columnar storage, which compresses data efficiently, making queries even faster. And with Redshift Spectrum, you can even query data residing directly in your Amazon S3 data lake without needing to load it into Redshift first – talk about convenience!
Why Redshift Deserves a Spot on This List:
Simply put, Redshift offers a potent combination of speed, scalability, and integration. It allows businesses of all sizes to perform complex analytical tasks without the hassle of managing infrastructure. Its tight integration with the AWS ecosystem provides seamless access to other services like SageMaker for machine learning and various security tools. This level of integration makes it a powerful tool in any analytic data solution arsenal.
Real-World Wins: Redshift in Action
Big names trust Redshift with their data. McDonald's uses it to analyze billions of transactions, optimizing everything from menu offerings to store operations. Airbnb leverages Redshift to personalize recommendations for millions of listings, enhancing the customer experience. Even Pfizer relies on Redshift to accelerate clinical research, potentially leading to faster drug discovery. If it's good enough for them, it might just be good enough for you.
Pros and Cons: Weighing the Benefits
Like any solution, Redshift has its strengths and weaknesses.
Pros:
Predictable Performance and Cost: You know what you're getting with Redshift, making budgeting and resource allocation much easier.
Deep AWS Integration: Seamlessly connect with other AWS services for a unified data ecosystem.
Advanced Security: Robust security features like VPC, encryption, and IAM keep your data safe and sound.
Automated Maintenance: Less time managing your data warehouse means more time focusing on your business.
Independent Scaling: Adjust compute and storage separately for optimized performance and cost efficiency.
Cons:
Scaling Flexibility: While scalable, it's not as flexible as some serverless alternatives.
Admin Overhead: Requires some administration, unlike completely serverless options.
Performance Tuning: Can require some expertise to squeeze out optimal performance.
Maintenance Tasks: Vacuum and analyze operations are necessary for maintaining optimal performance.
Actionable Tips: Getting the Most Out of Redshift
Distribution Keys and Sort Keys: Optimize these based on your query patterns for significant performance gains.
Workload Management (WLM): Prioritize important queries to ensure they get the resources they need.
Redshift Spectrum: Query your S3 data lake directly for cost-effective analysis of historical data.
Automated Table Optimization: Let Redshift automatically tune your tables for optimal performance.
Monitoring: Keep an eye on performance using CloudWatch and the query monitoring dashboard.
When to Use Redshift:
Consider Redshift if you need to:
Analyze large datasets quickly and efficiently.
Use standard SQL and your existing BI tools.
Integrate with other AWS services.
Have predictable performance and costs.
A Little History:
Launched by AWS in 2012, Redshift is built on technology acquired from ParAccel. Andy Jassy, former CEO of AWS, championed Redshift as a key component of AWS's analytics strategy.
5. Snowflake: A Cloud Data Platform Powerhouse for Analytic Data Solutions
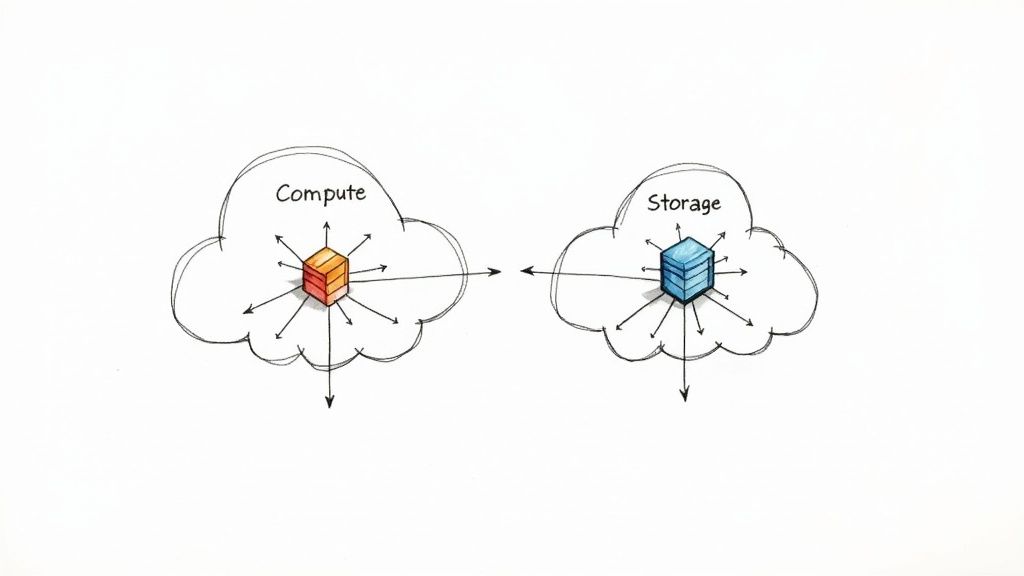
Snowflake is a leading cloud-based data warehousing platform delivered as a Software-as-a-Service (SaaS). It offers a comprehensive solution for data storage, processing, and, you guessed it, analytic data solutions. Its secret sauce? A unique architecture that separates compute from storage. This lets you scale resources independently, meaning you only pay for what you use and can adapt to fluctuating workloads without breaking a sweat. Snowflake seamlessly handles both structured and semi-structured data, and boasts near-unlimited concurrent users without any performance hiccups. This makes it a top contender for organizations seeking robust and scalable analytic data solutions.
How it Works: Snowflake's multi-cluster, shared data architecture is the key. Data is stored centrally, while independent compute clusters handle processing. This separation allows for incredible flexibility and concurrency. Need to run a massive report while simultaneously powering a real-time dashboard? No problem. Snowflake can handle it. Furthermore, its support for various data formats, from traditional SQL tables to JSON and Avro, makes it incredibly versatile for modern data needs.
Why Snowflake Deserves Its Place on this List: In the world of analytic data solutions, Snowflake shines. Its virtually limitless scalability, pay-as-you-go pricing, and ease of use make it a compelling choice for organizations of all sizes. It eliminates the headaches of managing infrastructure, allowing teams to focus on extracting value from their data. Its cloud-native nature ensures high availability and disaster recovery, further solidifying its position as a reliable platform.
Features and Benefits:
Multi-cluster, shared data architecture: Enables true concurrency and independent scaling.
Separation of storage, compute, and services: Offers unparalleled flexibility and cost optimization.
Automatic scaling and performance optimization: Simplifies management and ensures optimal performance.
Time travel and data cloning capabilities: Facilitates data recovery, testing, and development.
Support for semi-structured data (JSON, Avro, XML): Handles diverse data formats without complex transformations.
Zero-copy data sharing across organizations: Streamlines data collaboration and eliminates data silos.
Multi-cloud support (AWS, Azure, Google Cloud): Provides flexibility and avoids vendor lock-in.
Pros & Cons:
Pros:
Exceptional concurrency handling with independent compute clusters.
Minimal maintenance requirements (truly zero administration).
Flexible pricing model with per-second billing.
Native support for semi-structured data without transformation.
Seamless scalability for varying workloads.
Cons:
Can become expensive without proper resource governance.
Proprietary SQL extensions require some learning.
Limited stored procedure language compared to traditional databases.
Requires data migration for existing on-premises workloads.
Successful Implementations:
Capital One: Democratized data access across 50,000+ employees.
Nielsen: Processes petabytes of media consumption data.
Office Depot: Migrated from legacy systems to enable real-time analytics.
Actionable Tips:
Implement resource monitors to control compute costs.
Utilize appropriate warehouse sizes for different workload types.
Leverage data cloning for testing and development environments.
Use materialized views for frequently accessed query results.
Implement column-level security for granular access control.
When and Why to Use Snowflake:
Consider Snowflake if you need a highly scalable, performant, and cost-effective solution for your analytic data needs. It's ideal for organizations dealing with large volumes of data, complex analytics, and concurrent workloads. If you're looking to simplify data warehousing, reduce administrative overhead, and empower your teams with data-driven insights, Snowflake is a strong contender.
Popularized By: Founded by Benoit Dageville, Thierry Cruanes, and Marcin Żukowski in 2012, Snowflake experienced enormous growth under CEO Frank Slootman and achieved the largest software IPO in history at the time of its public offering in 2020.
6. Apache Spark: A Powerhouse for Analytic Data Solutions
Looking for an analytic data solution that can handle massive datasets and deliver lightning-fast results? Apache Spark might just be your answer. This open-source, distributed computing system is designed for big data workloads, making it a popular choice for everything from real-time stream processing to machine learning. It’s earned its spot on this list thanks to its versatility, speed, and a thriving ecosystem that supports diverse data processing needs.
So, how does this magic happen? Spark provides an interface for programming entire clusters of computers, allowing them to work together seamlessly on a single task. This "data parallelism" drastically speeds up processing, while built-in fault tolerance ensures that your jobs complete even if some hardware fails. Think of it like having a team of chefs working together in a perfectly coordinated kitchen, each handling a part of the meal prep to get the final dish out much faster.
Spark offers easy-to-use APIs in Java, Scala, Python, and R, catering to diverse skillsets. Even better, it boasts specialized libraries like Spark SQL for structured data processing (think databases), MLlib for machine learning, GraphX for graph computations (like social networks), and robust streaming capabilities. This unified approach simplifies your tech stack and makes Spark a comprehensive analytic data solution.
Netflix: Imagine processing the viewing data of millions of users in real-time to personalize recommendations and optimize content delivery. That's what Netflix does with Spark.
Uber: Fighting fraud in a global ride-sharing platform demands real-time analysis of massive transactional data. Spark provides the speed and scalability Uber needs.
eBay: Powering recommendation engines that suggest relevant products to millions of shoppers requires serious machine learning muscle. eBay leverages Spark to handle this massive undertaking.
Features and Benefits:
In-Memory Processing: Spark can store data in memory (RAM) for lightning-fast access, dramatically accelerating processing compared to traditional disk-based systems like Hadoop MapReduce.
Batch and Real-time Streaming: Whether you need to process data in batches or analyze it as it arrives, Spark's got you covered.
Advanced Analytics: MLlib empowers you to build sophisticated machine learning models for prediction, classification, and more.
Graph Processing: GraphX tackles complex network analysis and graph algorithms.
SQL Support: Spark SQL enables you to query data using familiar SQL syntax.
Multiple Language Support: Choose your preferred programming language from Java, Scala, Python, and R.
Pros and Cons:
Pros:
Significantly faster than Hadoop MapReduce.
Versatile for various data processing tasks (ETL, Machine Learning, Streaming).
Strong community support and active development.
Rich ecosystem of libraries and extensions.
Compatible with numerous data sources and formats.
Cons:
Steeper learning curve compared to some analytics tools.
Memory management can be challenging for very large workloads.
Optimal implementation may require skilled developers.
Performance tuning can be complex.
Tips for Success with Spark:
DataFrame API: Use the DataFrame API instead of the lower-level RDD API for improved performance and easier data manipulation.
Partitioning: Implement smart partitioning strategies to distribute data evenly across your cluster and avoid performance bottlenecks.
Memory Allocation: Carefully configure memory allocation based on your workload to prevent out-of-memory errors.
Broadcast Joins: Leverage broadcast joins when joining large and small datasets to optimize performance.
Tungsten Engine: Utilize the Tungsten execution engine for enhanced query optimization and faster execution.
A Bit of History:
Created by Matei Zaharia at UC Berkeley's AMPLab in 2009 and later contributed to the Apache Software Foundation in 2013, Spark has become a cornerstone of big data analytics. Databricks, founded by the original creators of Spark, further develops and commercializes the technology. (https://spark.apache.org/)
If you're dealing with large datasets and need a powerful, versatile analytic data solution, Apache Spark is definitely worth exploring. Its speed, scalability, and rich feature set make it a compelling choice for organizations looking to gain a competitive edge through data-driven insights.
7. SAS Analytics
Looking for a robust and reliable analytic data solution, particularly if you're in a highly regulated industry? SAS Analytics might be just what you need. This powerhouse suite of business analytics software, developed by the SAS Institute, offers a comprehensive set of tools for everything from advanced analytics and multivariate analyses to business intelligence, data management, and predictive analytics. It's like the Swiss Army knife of analytic data solutions, providing a tool for every analytical need.
SAS Analytics works by combining powerful statistical analysis with industry-specific solutions. This means you're not just getting generic tools; you're getting solutions tailored to the specific challenges of your industry. It’s particularly strong in highly regulated sectors like pharmaceuticals, finance, and healthcare, where validated and reproducible analytical processes are essential. Think of it as a trusted partner that helps you navigate complex data landscapes with confidence.
Features that make SAS Analytics stand out:
Enterprise-grade statistical analysis: From basic descriptive statistics to complex modeling, SAS has you covered.
Advanced predictive modeling and machine learning: Unlock the power of forecasting and predictive insights.
Text mining and natural language processing: Uncover hidden meanings in unstructured text data.
Visual analytics and interactive dashboarding: Bring your data to life with compelling visualizations.
Integrated data quality and governance: Maintain data integrity and compliance.
Industry-specific analytical applications: Tailored solutions for your unique business needs.
Process automation for analytical workflows: Streamline your analytical processes and save time.
Why SAS Analytics deserves its place on this list:
SAS Analytics has earned its reputation as a leader in the analytics space, and for good reason. Its comprehensive functionality, combined with a strong focus on governance and reproducibility, makes it an excellent choice for organizations looking for a dependable and scalable analytic data solution. It’s not just about analyzing data; it's about making data-driven decisions with confidence.
Pros:
Extremely robust and reliable: Ideal for mission-critical applications where accuracy and stability are paramount.
Comprehensive documentation and technical support: Get the help you need when you need it.
Validated analytical procedures for regulated industries: Meet stringent regulatory requirements.
End-to-end solution: Covers everything from data preparation to deployment.
Strong focus on governance and reproducibility: Ensure the integrity and reliability of your analyses.
Cons:
Higher cost: Compared to open-source alternatives, SAS comes with a premium price tag.
Proprietary programming language (SAS): Requires specialized skills, though SAS Enterprise Guide offers a point-and-click interface.
Resource-intensive: Deployment can require significant computing resources.
Less agile implementation: Can be less flexible than some newer, cloud-native tools.
Real-world examples of SAS Analytics in action:
Volvo: Uses SAS to predict vehicle component failures before they occur, improving safety and reducing maintenance costs.
HSBC: Implemented SAS for fraud detection and anti-money laundering compliance, protecting their business and customers.
Nestlé: Leverages SAS for demand forecasting across thousands of products, optimizing inventory and supply chain efficiency.
Actionable tips for getting the most out of SAS Analytics:
Use SAS Enterprise Guide: This provides a user-friendly point-and-click interface for accessing SAS functionality.
Leverage SAS Viya: This cloud-native platform offers enhanced scalability and flexibility.
Implement proper project governance using SAS Model Manager: Ensure model transparency and control.
Take advantage of industry-specific templates and accelerators: Jumpstart your analytics projects.
Utilize SAS macros: Increase code reusability and efficiency.
When and why to use SAS Analytics:
Choose SAS Analytics when you need a robust, reliable, and comprehensive analytic data solution, particularly if you operate in a highly regulated industry. It's the right choice when accuracy, reproducibility, and governance are top priorities, even if it comes with a higher cost and requires specialized skills.
Popularized By: Founded in 1976 by Anthony Barr, James Goodnight, John Sall, and Jane Helwig, SAS Institute has been led by CEO James Goodnight, one of the longest-serving CEOs in history. SAS has established itself as the gold standard for analytics in numerous industries, particularly pharmaceuticals, financial services, and healthcare.
SAS Website
8. Databricks Lakehouse Platform
Looking for an analytic data solution that can handle everything from data engineering to machine learning? The Databricks Lakehouse Platform might be just what you need. It's a unified platform that combines the best of data lakes and data warehouses, offering a one-stop shop for all your data needs. This makes it a worthy contender in the realm of analytic data solutions, especially for organizations dealing with large datasets and complex analytical requirements.
So, how does it work? Databricks sits on top of your existing cloud storage (like AWS, Azure, or GCP) and uses open-source technologies like Apache Spark and Delta Lake to provide a powerful and scalable platform. This allows you to ingest, process, and analyze massive amounts of data, all within a single environment. Think of it as a central hub where your data engineers, data scientists, and analysts can collaborate seamlessly.
One of the key features that sets Databricks apart is Delta Lake. This provides ACID transactions (Atomicity, Consistency, Isolation, Durability) on your data lake, ensuring data reliability and consistency – a crucial aspect for any robust analytic data solution. For lightning-fast SQL performance, Databricks leverages its Photon engine, making your queries run significantly faster. And if you're into machine learning, Databricks has you covered with MLflow for managing the entire ML lifecycle and a Feature Store for reusing valuable features. It even offers automated MLOps capabilities to streamline your machine learning operations. Need centralized data governance? Unity Catalog provides a single point of control for all your data assets.
Companies like Shell, Comcast, and H&M are already leveraging the power of Databricks. Shell uses it to process IoT data from thousands of oil wells for predictive maintenance, while Comcast uses it to personalize content recommendations for millions of viewers. H&M, on the other hand, leverages Databricks to optimize their global supply chain and inventory management. These examples highlight Databricks' versatility as an analytic data solution across various industries.
Pros:
Unified workflows: Streamlines data engineering and data science processes.
Scalability: Handles petabyte-scale workloads without breaking a sweat.
Open-source foundation: Built on reliable open-source tech with added commercial enhancements.
Robust MLOps: Strong support for machine learning operations.
Cloud integration: Works seamlessly with major cloud providers.
Cons:
Steep learning curve: Can be challenging for non-technical users.
Premium pricing: More expensive than purely open-source options.
Complex architecture: Requires skilled implementation and management.
Focus on advanced analytics: Less suited for basic operational reporting.
Tips for Success with Databricks:
Implement Delta Lake for reliable data lake functionality.
Use Databricks SQL for analytics workloads on processed data.
Leverage Databricks Auto ML to accelerate model development.
Implement proper cluster policies to control compute costs.
Use notebook workflows for orchestrating complex data pipelines.
When to Use Databricks:
Consider Databricks if you need a powerful and scalable platform for advanced analytics, machine learning, and data engineering. It’s especially beneficial if you’re dealing with large datasets, require real-time data processing, and want a unified environment for collaboration.
While Databricks offers significant advantages, it's important to consider the potential privacy implications of handling sensitive data, especially when dealing with machine learning. You can learn more about Databricks Lakehouse Platform and explore resources on privacy-preserving machine learning techniques.
Databricks was founded by the original creators of Apache Spark, including industry luminaries like Ali Ghodsi, Matei Zaharia, and Ion Stoica. They pioneered the 'lakehouse' architectural paradigm and have raised billions in funding, highlighting the platform's significance in the data world. If you’re looking for a cutting-edge analytic data solution that can handle the most demanding data challenges, Databricks is definitely worth considering.
Top 8 Analytic Data Solutions Comparison
Solution
🔄 Implementation Complexity
💡 Resource Requirements
⭐ Expected Outcomes
📊 Ideal Use Cases
⚡ Key Advantages
Tableau
Moderate; intuitive drag-and-drop, some advanced features need learning
Moderate; requires subscription and decent hardware for large datasets
High-quality interactive visualizations and actionable insights
Business intelligence, dashboarding, non-technical users
Intuitive UI, strong customization, broad data source integration
Microsoft Power BI
Moderate to High; DAX learning curve for complex modeling
Low to Moderate; cost-effective with MS ecosystem integration
Effective self-service BI with AI-powered visuals
Organizations using Microsoft stack, self-service analytics
Cost-effective, deep MS ecosystem integration, strong security
Google BigQuery
Moderate; requires SQL knowledge and query optimization
High; premium pricing with extensive compute needs
Unified data engineering, science, and ML workflows
Advanced analytics, large-scale ML, collaborative data science
Lakehouse architecture, ML lifecycle, multi-cloud support
Navigating the Data-Driven Future
From visualizing trends with Tableau and Power BI to harnessing the raw power of cloud-based data warehouses like Google BigQuery, Amazon Redshift, and Snowflake, the world of analytic data solutions offers a powerful toolkit for any organization. We've explored eight leading platforms, each with its own strengths, whether it's the scalable data processing of Apache Spark, the statistical depth of SAS Analytics, or the unified approach of the Databricks Lakehouse Platform. The key takeaway? Mastering the right analytic data solutions empowers you to transform raw data into actionable insights, driving smarter decisions and fostering a culture of data-driven innovation. This translates to optimized operations, personalized customer experiences, and ultimately, a significant competitive edge in today's dynamic market.
The future is undeniably data-driven, and choosing the right analytic data solution is paramount to success. Don't navigate this complex landscape alone. NILG.AI empowers organizations to unlock the full potential of their data through expert guidance, tailored AI strategies, and seamless implementation of the perfect analytic data solutions for your unique needs. Visit NILG.AI today to discover how we can help you build a brighter, data-powered future.
Like this story?
Subscribe to Our Newsletter
Special offers, latest news and quality content in your inbox.
Signup single post
Recommended Articles
Article
Learning and Development AI: Transform Corporate Training
Jun 2, 2026 in
Guide: Explainer
Transform corporate training with learning and development AI. Explore strategic benefits, use cases, and implementation insights for decision-makers.
Artificial Intelligence Disruption: Guide for Executives
May 18, 2026 in
Guide: Explainer
Turn artificial intelligence disruption into growth. This executive guide offers actionable frameworks to transform threats into strategic opportunities.
We use cookies on our website to give you the most relevant experience by remembering your preferences and repeat visits. By clicking “Accept All”, you consent to the use of ALL the cookies. However, you may visit "Cookie Settings" to provide a controlled consent.
This website uses cookies to improve your experience while you navigate through the website. Out of these, the cookies that are categorized as necessary are stored on your browser as they are essential for the working of basic functionalities of the website. We also use third-party cookies that help us analyze and understand how you use this website. These cookies will be stored in your browser only with your consent. You also have the option to opt-out of these cookies. But opting out of some of these cookies may affect your browsing experience.
Necessary cookies are absolutely essential for the website to function properly. These cookies ensure basic functionalities and security features of the website, anonymously.
Cookie
Duration
Description
cookielawinfo-checkbox-analytics
11 months
This cookie is set by GDPR Cookie Consent plugin. The cookie is used to store the user consent for the cookies in the category "Analytics".
cookielawinfo-checkbox-functional
11 months
The cookie is set by GDPR cookie consent to record the user consent for the cookies in the category "Functional".
cookielawinfo-checkbox-necessary
11 months
This cookie is set by GDPR Cookie Consent plugin. The cookies is used to store the user consent for the cookies in the category "Necessary".
cookielawinfo-checkbox-others
11 months
This cookie is set by GDPR Cookie Consent plugin. The cookie is used to store the user consent for the cookies in the category "Other.
cookielawinfo-checkbox-performance
11 months
This cookie is set by GDPR Cookie Consent plugin. The cookie is used to store the user consent for the cookies in the category "Performance".
viewed_cookie_policy
11 months
The cookie is set by the GDPR Cookie Consent plugin and is used to store whether or not user has consented to the use of cookies. It does not store any personal data.
Functional cookies help to perform certain functionalities like sharing the content of the website on social media platforms, collect feedbacks, and other third-party features.
Performance cookies are used to understand and analyze the key performance indexes of the website which helps in delivering a better user experience for the visitors.
Analytical cookies are used to understand how visitors interact with the website. These cookies help provide information on metrics the number of visitors, bounce rate, traffic source, etc.
Advertisement cookies are used to provide visitors with relevant ads and marketing campaigns. These cookies track visitors across websites and collect information to provide customized ads.