Unlocking Business Success with Operational Efficiency
Want to boost your bottom line and gain a competitive edge? This listicle reveals eight crucial operational efficiency metrics you need to track in 2025. We’ll cover key indicators like Overall Equipment Effectiveness (OEE), Cycle Time, and First Pass Yield (FPY), plus others essential for optimizing processes and reducing costs. Learn how monitoring these operational efficiency metrics can unlock greater productivity, improve resource allocation, and drive sustainable growth.
1. Overall Equipment Effectiveness (OEE)
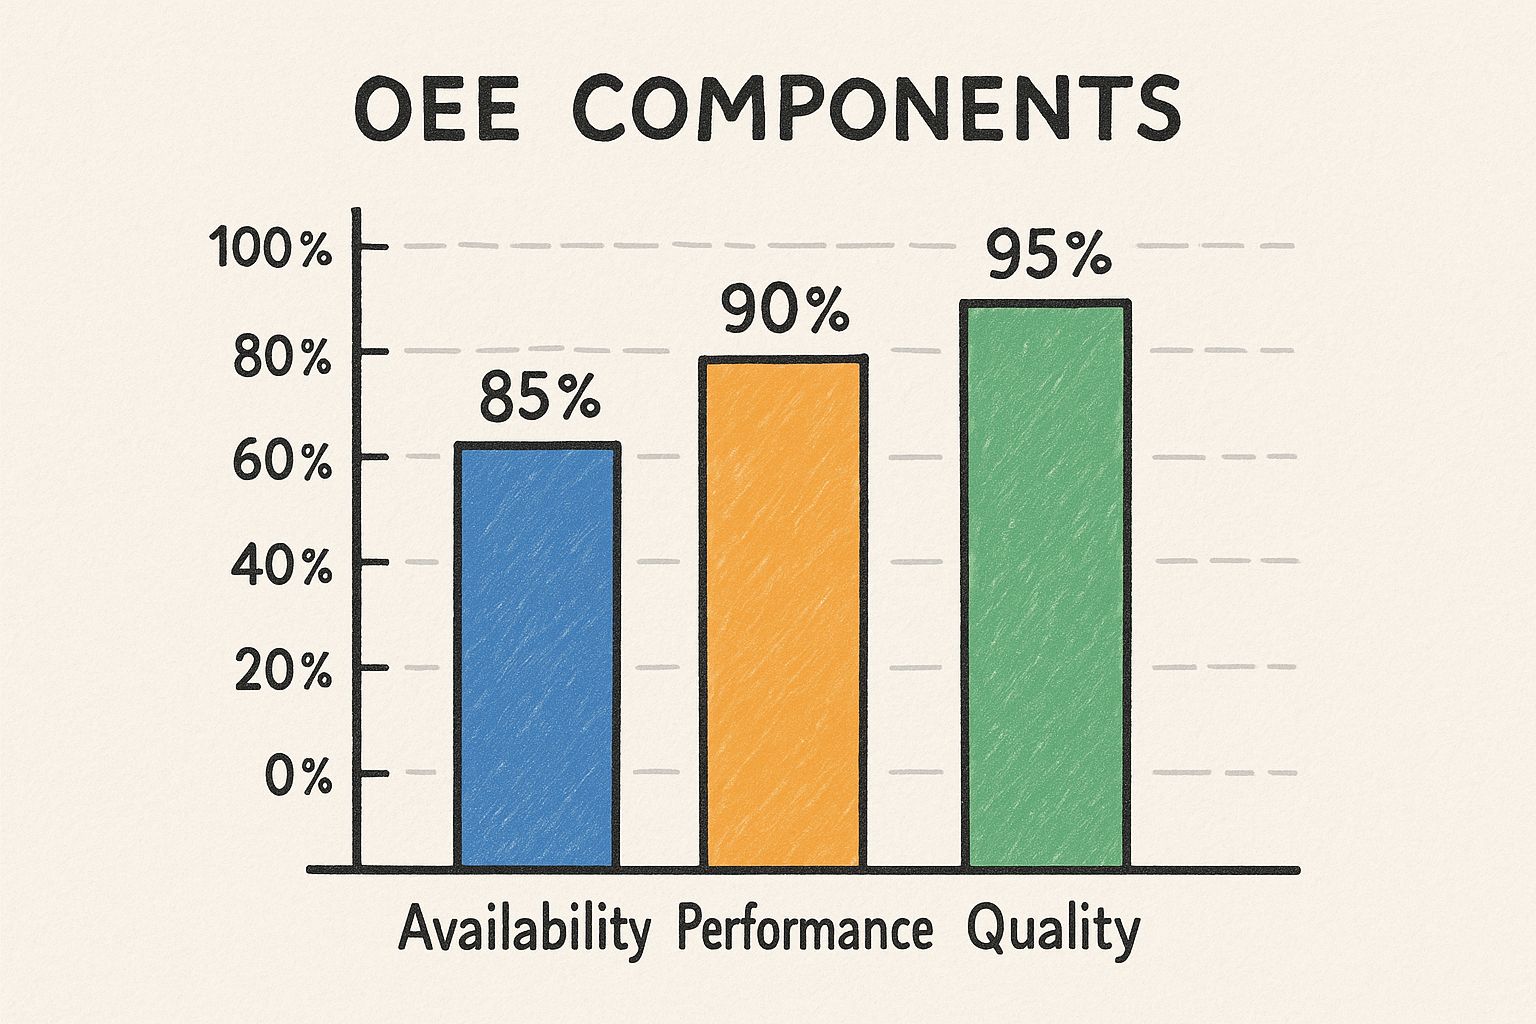
If you’re looking for a powerful way to boost your operational efficiency, Overall Equipment Effectiveness (OEE) should be at the top of your list. OEE gives you a single, comprehensive number that tells you how well your manufacturing operation is performing compared to its full potential. Think of it as a complete checkup for your production line. It works by combining three critical factors: Availability (how much time your equipment is actually running), Performance (how fast it’s running when it is running), and Quality (what percentage of the output is good). Multiply these three factors together, and you get your OEE percentage. This provides a much clearer picture than simply looking at output alone.
The infographic above visually breaks down OEE into its three core components: Availability, Performance, and Quality. It provides a clear illustration of how losses in each area contribute to the overall OEE score. For instance, the chart demonstrates how planned downtime, unplanned downtime, and other factors impact availability. It also highlights how speed losses and defect losses affect Performance and Quality, respectively. This visualization helps pinpoint the specific areas that need the most attention for improvement.
So, why does OEE deserve a top spot on the list of operational efficiency metrics? Because it provides a holistic view of your production efficiency. Instead of looking at isolated metrics, OEE combines the most critical ones into one powerful number. This makes it incredibly easy to benchmark performance across different equipment, production lines, or even entire facilities. And, because it highlights specific areas for improvement – equipment downtime, slow cycles, or quality issues – you can quickly identify the biggest opportunities to boost your bottom line. A world-class OEE score is generally considered to be 85% or higher.
OEE is particularly useful in manufacturing environments, but its principles can be adapted to other industries as well. Whether you’re in automotive, pharmaceuticals, or food processing, OEE can help you identify and eliminate bottlenecks, reduce waste, and improve your overall operational efficiency. Companies like Toyota, Harley-Davidson, and Intel have all leveraged OEE to achieve significant performance improvements. Toyota, for example, uses OEE as a cornerstone metric in its manufacturing plants, consistently achieving over 85% OEE, a testament to the system’s effectiveness. Harley-Davidson implemented OEE tracking and saw annual productivity increases of 2.4%. Intel utilized OEE to optimize semiconductor manufacturing, resulting in a 30% improvement in equipment utilization.
Here are some actionable tips to get you started with OEE:
Start Small: Begin with a pilot implementation on one critical production line. This allows you to refine your data collection processes and demonstrate the value of OEE before scaling up.
Define and Standardize: Ensure that the three components (Availability, Performance, and Quality) are clearly defined and measured consistently across all your operations.
Automate Data Collection: Use automated data collection systems whenever possible to increase accuracy and reduce manual effort.
Set Realistic Targets: Set achievable improvement targets based on industry benchmarks and your current performance levels.
Visualize Your Progress: Create visual management boards to display OEE in real-time. This makes it easy for everyone to see the impact of improvement initiatives.
While OEE is a powerful tool, it does have some potential drawbacks. Implementing it can be complex without proper data collection systems. It’s also possible to manipulate the metric by adjusting standards or definitions. In some cases, OEE can oversimplify complex production environments. And, to be truly comparable, you need a consistent measurement methodology across all your operations.
Despite these challenges, the benefits of OEE far outweigh the drawbacks. It’s a powerful metric that can help you drive significant improvements in operational efficiency. By understanding how OEE works and implementing it effectively, you can unlock the full potential of your production operations.
2. Cycle Time
Want to boost your operational efficiency? Look no further than cycle time, a crucial operational efficiency metric that measures the total time it takes to complete a process from start to finish. Think of it as the time it takes to produce one widget, handle a customer service request, or process an invoice. It encompasses everything from actual processing and inspections to the time spent moving things around and, unfortunately, waiting. Reducing cycle time is a key lever for improved productivity and happier customers.
Cycle time is measured in units of time – seconds, minutes, hours, or even days, depending on the complexity of the process. It applies across the board, from manufacturing and service delivery to administrative workflows. A key aspect of analyzing cycle time is breaking it down into value-adding activities (those that directly contribute to the final product or service) and non-value-adding activities (like waiting or unnecessary handoffs). This breakdown helps pinpoint areas for improvement. Cycle time directly impacts throughput (how much you produce in a given time) and capacity (how much you can produce).
Why does cycle time deserve a spot on the operational efficiency metrics podium? Because it directly correlates with productivity and output capacity. Improvements in cycle time typically translate to cost reductions. By identifying bottlenecks and inefficiencies, you can streamline processes and get more bang for your buck. Plus, it’s a customer-facing metric, directly tied to service level expectations. Faster service usually means happier customers.
Think about Amazon’s warehouses. They’ve mastered the art of optimizing picking cycle time using advanced routing algorithms, cutting fulfillment time significantly. Or Bank of America, who slashed loan application cycle time dramatically through process redesign. Even Dell revolutionized computer manufacturing by shrinking build cycle time from days to mere hours. These examples illustrate the power of focusing on cycle time as a key operational efficiency metric.
Here are some actionable tips to optimize your own cycle times:
Map it out: Visually map your entire process to identify those pesky non-value-adding steps that can be eliminated.
Standardize: Implement standardized work procedures to minimize variation in cycle time and make processes more predictable.
Visual Management: Use visual cues (like dashboards or Kanban boards) to quickly highlight when processes exceed target cycle times.
Analyze: Conduct time studies or video analysis to pinpoint improvement opportunities. Get granular!
Bottlenecks First: Focus your improvement efforts on bottleneck operations – the steps that constrain the entire process.
While focusing on cycle time is generally a good thing, it’s important to be aware of the potential downsides. Obsessing over speed can sometimes compromise quality if corners are cut. It’s important to maintain a balance. Also, remember that different products or services may naturally have different optimal cycle times. A custom-built car will naturally have a longer cycle time than a mass-produced one. Finally, consistency is key. Ensure you have consistent definitions and measurement approaches across your organization to avoid apples-to-oranges comparisons.
For those interested in diving deeper, learn more about Cycle Time. Pioneers like Henry Ford and Taiichi Ohno (of Toyota Production System fame), along with methodologies like Six Sigma and Lean manufacturing, have championed the importance of cycle time optimization. By understanding and actively managing this metric, you can unlock significant gains in operational efficiency and drive tangible business results.
3. First Pass Yield (FPY)
First Pass Yield (FPY) is a crucial operational efficiency metric that tells you what percentage of units or items successfully make it through a process on their first try without needing any fixes, retests, or adjustments. Think of it as a measure of how often you get things right the first time around. A high FPY means fewer resources wasted on rework, lower costs, and happier customers who get higher-quality products faster. This is why it deserves a spot on any list of important operational efficiency metrics, offering a direct line of sight into the effectiveness and quality of your processes.
FPY is expressed as a percentage. For example, an FPY of 90% means that 90 out of 100 units passed inspection on their first go. You can track FPY at various points: individual steps in a process, an entire production line, or even across different departments. It’s closely tied to your defect rates and how much those defects are costing you. Industries with strict quality controls, like pharmaceuticals and medical device manufacturing, rely heavily on FPY to maintain high standards.
Features and Benefits:
Direct Cost Correlation: Less rework directly translates to lower costs – saving you money on labor, materials, and time.
Systemic Issue Identification: A low FPY points to underlying problems in your processes, allowing you to focus improvement efforts where they matter most.
Easy to Grasp: The concept is straightforward, making it easy to communicate and understand across all levels of your organization, from the shop floor to the boardroom.
Happy Customers: Higher quality and quicker delivery times lead to increased customer satisfaction.
Pros and Cons:
Pros: Directly correlates with quality costs, highlights systemic issues, easy to calculate and understand, improves customer satisfaction.
Cons: Can incentivize passing subpar units, doesn’t account for defect severity, can be difficult to track in complex processes, requires consistent quality standards.
Examples of Success:
Motorola: Famously achieved over 99.9% FPY in their manufacturing operations through Six Sigma.
Intel: Uses FPY as a key driver of semiconductor manufacturing quality, aiming for rates exceeding 95%.
GE Healthcare: Boosted FPY from 78% to 93% in medical device manufacturing, saving millions in rework costs.
Actionable Tips for Implementation:
Define Defects Clearly: Everyone needs to agree on what constitutes a defect. No ambiguity allowed!
Track at Multiple Levels: Monitor FPY at both the individual process step and the overall product level for a comprehensive view.
Root Cause Analysis: When failures occur, dig deep to understand the root causes and prevent them from happening again.
Visual Management: Use charts and dashboards to display current FPY and target goals, making progress transparent to the team.
Consistent Inspections: Ensure your inspection methods are consistent and reliable across the board.
When and Why to Use FPY:
FPY is particularly valuable when:
Quality is paramount: In industries with stringent quality requirements or where defects have significant consequences.
Rework is expensive: When the cost of fixing errors is substantial.
Process improvement is a focus: FPY provides a clear metric to track progress and identify areas for improvement.
FPY is a powerful operational efficiency metric popularized by the Six Sigma methodology and quality management experts like Philip Crosby. By understanding and implementing FPY tracking, businesses can significantly enhance their processes, reduce costs, and improve customer satisfaction. It’s a metric that truly embodies the idea of “doing it right the first time.”
4. Labor Productivity
Labor productivity is a cornerstone operational efficiency metric that tells you how much output you’re getting for each unit of labor you put in. Think of it as a direct measure of how effectively your team is using their time and skills to create value. It’s calculated by dividing the total output by the total labor hours. This metric is crucial because it directly impacts your bottom line – higher labor productivity translates to lower costs and increased profitability, making you more competitive. This is why it deserves a prominent place in any discussion about operational efficiency metrics.
So, how does it work in practice? Let’s say your team produces 100 widgets in an 8-hour shift. Your labor productivity would be 12.5 widgets per labor hour (100 widgets / 8 hours). This simple calculation can be applied across various industries and scaled to different levels, from individual employees to entire departments or even the whole organization. You can measure output in units produced, revenue generated, or value added, depending on what’s most relevant to your business.
Features and Benefits:
Labor productivity isn’t a one-size-fits-all metric. It’s flexible and can be tailored to your specific needs:
Expressed in various units: You can measure it as units per labor hour, value added per labor hour, or other relevant metrics.
Multi-level measurement: Track productivity at individual, team, department, or organizational levels to pinpoint areas for improvement.
Influencing factors: Understanding factors like skill levels, tools/equipment, processes, and management practices allows you to leverage them for productivity gains.
Key driver of costs and competitiveness: Labor productivity directly impacts unit labor costs, making it a critical factor in overall competitiveness.
Pros:
Profitability and Cost Management: Improved labor productivity leads directly to lower labor costs and higher profits.
Benchmarking: Compare your performance to industry averages and identify areas for improvement.
Easy to Understand: The concept is simple and easy to communicate across all organizational levels.
Investment Justification: Provides data-driven justification for investments in training, tools, and process improvements.
Cons:
Unrealistic Expectations: Focusing solely on continuous improvement can lead to burnout and unrealistic expectations.
Pressure on Safety and Quality: Excessive pressure to boost productivity can compromise safety and quality if not managed carefully.
Oversimplification: Doesn’t always account for differences in product complexity, value, or external factors.
Potential for Manipulation: Metrics can be manipulated by changing product mix or definitions, so ensure consistent measurement practices.
Examples of Successful Implementation:
Toyota: Their renowned production system achieves labor productivity almost double the industry average through standardized work, continuous improvement (Kaizen), and minimizing waste.
UPS: By optimizing delivery routes, employing advanced logistics technology, and standardizing driver methods, UPS achieves industry-leading packages delivered per driver hour.
Southwest Airlines: Streamlined operations, cross-trained employees, and a focus on efficient turnaround times contribute to their high employee productivity (passengers per employee).
Actionable Tips:
Define Consistent Output Measures: Use metrics that accurately reflect value creation and are relevant to your business goals.
Track Trends: Focus on productivity trends over time rather than fixating on absolute values to understand progress and identify patterns.
Identify Opportunities: Use productivity data to pinpoint areas where training, new tools, or process improvements can have the biggest impact.
Balance with Other Metrics: Don’t prioritize productivity at the expense of safety and quality. Maintain a balanced scorecard.
Employee Involvement: Share productivity data with employees and involve them in identifying and implementing improvement initiatives – this fosters ownership and buy-in.
When and Why to Use Labor Productivity as an Operational Efficiency Metric:
Labor productivity is a relevant metric for nearly any organization where human labor is a significant input. It’s particularly valuable when:
Labor costs are a major expense: If labor is a significant portion of your operational costs, improving productivity can significantly impact profitability.
Competition is based on price: In price-sensitive markets, higher labor productivity provides a competitive edge.
You’re scaling operations: As you grow, maintaining or improving labor productivity is essential for sustainable profitability.
You’re implementing process improvements: Track labor productivity to measure the impact of process changes and identify further optimization opportunities.
By understanding and effectively using labor productivity as a key operational efficiency metric, you can unlock significant gains in profitability, competitiveness, and overall operational excellence.
5. Capacity Utilization Rate
Capacity Utilization Rate – it’s a mouthful, right? But trust us, this operational efficiency metric is a powerhouse when it comes to understanding how well you’re using your resources. In simple terms, it tells you how much of your potential output you’re actually achieving. Think of it like this: if your bakery could bake 100 loaves of bread a day, but you’re only baking 75, your capacity utilization rate is 75%. This metric is key for anyone looking to boost their operational efficiency metrics, and it deserves its place on this list because it offers a direct path to squeezing more value out of what you already have.
So how does it work? You essentially compare your actual output to your theoretical maximum capacity. This is typically expressed as a percentage. You can calculate this for individual machines (like that bread oven), entire production lines (all the steps to make that loaf), or even your entire facility (the whole bakery). It gives you a clear picture of your resource allocation efficiency and can pinpoint bottlenecks faster than you can say “sourdough.”
Features and Benefits:
Percentage-Based: Easy to understand and compare across different areas of your business.
Granular Analysis: Measure utilization for individual resources, lines, or entire facilities.
Bottleneck Identification: Highlights where resources are underutilized or overstretched.
Industry Benchmarking: While optimal rates vary (e.g., 70-85% in manufacturing), comparing your rate to industry averages can provide valuable insights. (Note: different calculation methods can make direct comparisons tricky.)
Pros:
Find Hidden Potential: Uncover underutilized assets and opportunities to increase output without spending a dime on new equipment.
Smarter Scheduling: Optimize production schedules and resource allocation for maximum efficiency.
Informed Investments: Support capital expenditure decisions by identifying true capacity constraints.
Economic Indicator: Provides valuable insights into your company’s performance and even the broader industry.
Cons:
Defining “Maximum”: Figuring out your theoretical maximum capacity can be tough. It needs to be realistic and account for things like planned maintenance and setup times.
Masking Inefficiencies: A high utilization rate might look good on paper, but it could be hiding inefficient processes or excessive resource consumption. Don’t just chase a high number – make sure you’re also being efficient.
100% Isn’t Ideal: Striving for 100% utilization is usually unrealistic and even undesirable. You need buffer room for maintenance, unexpected downtime, and fluctuations in demand.
Benchmarking Challenges: Different companies use different calculation methods, making industry benchmarking a bit more complicated.
Real-World Examples:
Steel Manufacturers: Giants in the steel industry track capacity utilization of their blast furnaces like hawks, often maintaining 85-90% utilization despite fluctuating demand.
Airlines: Load factors (the percentage of seats filled) are a crucial capacity utilization metric for airlines. Delta, for example, consistently achieves industry-leading load factors above 85%.
Cloud Computing: Providers like AWS rely on sophisticated algorithms to maximize data center capacity utilization, ensuring they squeeze every drop of performance from their servers.
Actionable Tips:
Realistic Capacity: When defining your theoretical capacity, factor in planned maintenance, setup time, and realistic downtime.
Segmentation is Key: Break down capacity utilization by time periods (daily, weekly, monthly) to identify patterns and opportunities for improvement.
Balance and Flexibility: Aim for high utilization but maintain enough flexibility to respond to unexpected changes in demand.
Pricing Strategies: Use capacity utilization data to inform your pricing strategies during peak and off-peak periods. Charge a premium when you’re near capacity and offer discounts during slower periods.
Demand Leveling: Explore techniques like offering incentives or promotions to smooth out demand and maintain a more stable utilization rate.
Who Made it Famous?
The Federal Reserve uses capacity utilization rates as a key economic indicator. Management consulting firms like McKinsey & Company also leverage this metric extensively. You’ll also find it popping up in the Theory of Constraints methodology and in the toolkit of any Operations Research practitioner.
By understanding and effectively using capacity utilization rate, you can unlock hidden potential, optimize resource allocation, and drive significant improvements in your overall operational efficiency.
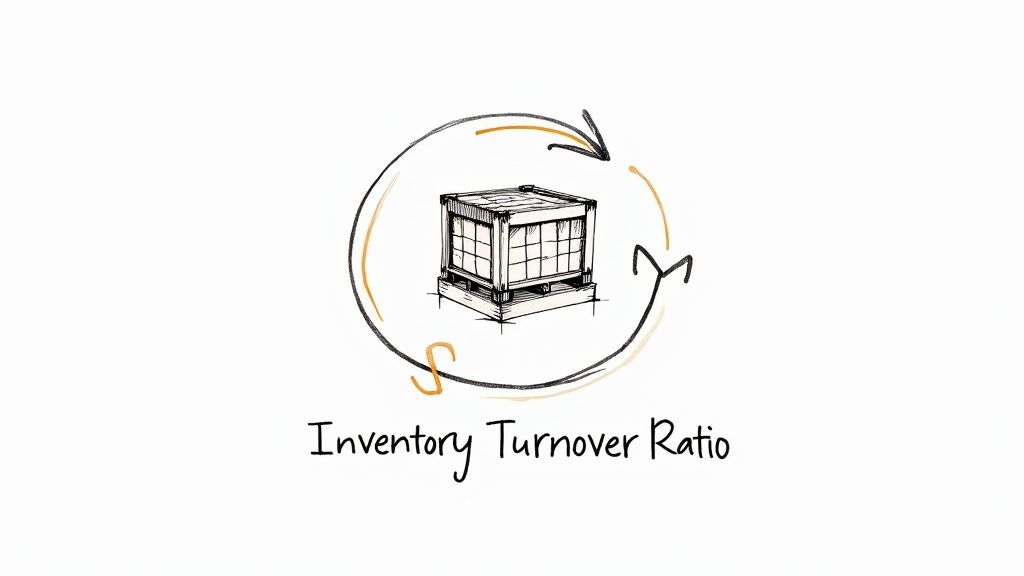
6. Inventory Turnover Ratio
Want to know how effectively your business is managing its inventory? The Inventory Turnover Ratio is a key operational efficiency metric that gives you a solid grasp on how quickly your inventory is sold or used. Essentially, it tells you how many times your entire inventory is sold and replaced over a specific period, usually a year. This is vital for understanding how efficiently your working capital is being used and whether you’re carrying too much (or too little) stock. It deserves a spot on this list because it’s a direct indicator of how well you’re balancing the costs of holding inventory with the risk of running out.
So, how does it work? It’s a simple calculation: Cost of Goods Sold (COGS) / Average Inventory. Your COGS is the total cost of the products you sold during the period, and your average inventory is the average value of your inventory over that same period. While a year is typical, you can calculate this ratio for any period (quarterly, monthly, etc.) to get a more granular view.
Features and Benefits:
Simple Calculation: (Cost of Goods Sold ÷ Average Inventory)
Flexible Timeframe: Typically measured annually, but can be calculated for any time period.
Granular Analysis: Can be drilled down to individual SKUs or product categories for targeted insights.
Working Capital Efficiency: Helps identify opportunities to free up cash flow tied up in excess inventory.
Risk Management: Highlights potential stockout risks or overstocking issues.
Pros:
Identifies Inventory Issues: Clearly shows if you’re holding onto too much inventory or risking stockouts.
Improves Cash Flow: Reveals opportunities to optimize working capital and free up cash.
Enhances Planning: Helps improve purchasing and production planning processes.
Spotlights Potential Problems: A decreasing turnover rate can indicate product obsolescence or quality issues.
Cons:
Misleading High Turnover: A very high turnover could mean you’re not holding enough inventory and risking lost sales due to stockouts.
Seasonal Fluctuations: Seasonality can significantly impact the ratio, making comparisons challenging.
Accounting Method Impact: Different accounting methods (FIFO, LIFO, weighted average) can affect the ratio’s comparability between companies.
Strategic Inventory Ignored: Doesn’t account for strategic inventory decisions, like holding buffer stock for anticipated demand surges.
Examples of Success:
Apple: Achieves incredible inventory turns of 40-50 times per year thanks to their highly sophisticated supply chain.
Walmart: Maintains efficient inventory turns of approximately 8-9 times per year through optimized logistics and strong vendor relationships.
Toyota: Their legendary just-in-time system allows for inventory turns of 20+ times per year, minimizing working capital tied up in inventory.
Actionable Tips:
ABC Analysis: Categorize your inventory by value and volume (A, B, C) to prioritize improvement efforts on your most important items.
Regular Audits: Conduct frequent inventory audits to ensure data accuracy and identify discrepancies.
Vendor-Managed Inventory: Partner with key suppliers on vendor-managed inventory (VMI) programs to streamline replenishment.
EOQ Calculation: Use the Economic Order Quantity (EOQ) formula to determine the optimal order size for each item, minimizing total inventory costs.
Demand Forecasting: Implement forecasting systems to better anticipate demand fluctuations and adjust inventory levels proactively.
When and Why to Use This Approach:
The Inventory Turnover Ratio is relevant for any business that holds inventory. It’s particularly valuable for:
Retailers: To optimize stock levels and minimize storage costs.
Manufacturers: To streamline production and reduce work-in-progress inventory.
E-commerce Businesses: To manage fulfillment center efficiency and prevent stockouts.
By tracking and analyzing your Inventory Turnover Ratio, you gain valuable insights into your operational efficiency, improve decision-making related to inventory management, and ultimately boost your bottom line.
7. Cash Conversion Cycle (CCC)
Want to know how quickly your business turns investments in inventory and resources into cold, hard cash? That’s where the Cash Conversion Cycle (CCC) comes in. This crucial operational efficiency metric measures the time it takes for a company to convert its investments in inventory into sales and finally into cash flow. It’s a powerful tool for understanding how efficiently you’re managing your working capital and overall operational efficiency. A lower CCC generally means you’re getting cash in hand faster, which is a great sign for any business. This is why it deserves a spot on any list of top operational efficiency metrics.
How It Works:
Think of the CCC as a timeline. It combines three key metrics:
Days Inventory Outstanding (DIO): The average number of days it takes to sell inventory.
Days Sales Outstanding (DSO): The average number of days it takes to collect payment after a sale.
Days Payables Outstanding (DPO): The average number of days it takes to pay suppliers.
The formula? CCC = DIO + DSO – DPO. So, you add the time it takes to sell inventory and collect payment, then subtract the time you take to pay your suppliers.
Features and Benefits:
The CCC is measured in days, and as mentioned, lower is generally better. It gives you a comprehensive view of both operational and financial efficiency by combining those three key metrics. This helps you pinpoint opportunities to improve cash flow without necessarily changing your core operations. Plus, it allows for apples-to-apples comparisons across companies, regardless of their size. And perhaps most importantly, it directly impacts your working capital requirements and those pesky financing costs.
Pros:
Comprehensive insight into both operational and financial performance.
Highlights areas for cash flow improvement without impacting operations.
Enables benchmarking against competitors.
Directly influences working capital needs and financing expenses.
Cons:
Can sometimes encourage practices like delaying supplier payments, which can strain those important relationships.
Doesn’t always account for industry-specific nuances or seasonal fluctuations.
Improvements in one area might negatively impact others (e.g., pushing for faster collections could annoy customers).
Requires accurate accounting data, which isn’t always easy to come by.
Examples of Success:
Dell: Revolutionized the PC industry with a negative CCC, meaning they collected payment before paying suppliers. Talk about efficient!
Amazon: Slashed their CCC from over 40 days to under 30 days through smart supply chain optimization.
Walmart: Maintains a consistently negative CCC through tight supplier management and incredibly efficient inventory control.
Actionable Tips:
Break down the CCC into its individual components (DIO, DSO, DPO) to identify specific improvement opportunities.
Negotiate vendor payment terms that sync up with your sales cycle.
Implement robust inventory management systems to lower DIO.
Offer early payment discounts to customers to encourage faster payment and reduce DSO.
Benchmark against industry leaders to set realistic targets and stay competitive.
When and Why to Use CCC:
The CCC is invaluable for businesses of all sizes, from startups to established corporations. It’s especially useful for:
Monitoring working capital efficiency: See how well you’re managing your short-term assets and liabilities.
Identifying cash flow bottlenecks: Pinpoint where your cash flow is getting stuck and find ways to free it up.
Evaluating the impact of operational changes: See how changes in inventory management, sales processes, or payment terms affect your overall cash conversion cycle.
Benchmarking against competitors: Understand how your cash conversion cycle stacks up against others in your industry.
The CCC is a vital tool for any business looking to boost operational efficiency and improve their bottom line. By understanding how this metric works and using the tips provided, you can unlock significant improvements in your cash flow and overall financial health.
8. Order Fulfillment Cycle Time
Order Fulfillment Cycle Time (OFCT) is a crucial operational efficiency metric that measures the time it takes for an order to journey from the customer’s clicking “buy” to the moment it arrives at their doorstep. This end-to-end metric provides a holistic, customer-centric view of your operational efficiency, encompassing everything from order processing and inventory picking to packing, shipping, and final delivery. In the competitive landscape of today’s market, a streamlined OFCT directly impacts customer satisfaction, loyalty, and ultimately, your bottom line. This is why it deserves a prominent place in any discussion of operational efficiency metrics.
So how does it work? Imagine a customer ordering a new phone online. The clock starts ticking the moment they complete the purchase. It keeps ticking as the order is processed, the phone is located in the warehouse, packaged, handed off to the shipping carrier, and finally delivered. The total time elapsed constitutes your Order Fulfillment Cycle Time. This metric is typically measured in hours, days, or even weeks, depending on the industry and the nature of the product. For a pizza delivery, you’re looking at minutes; for custom-made furniture, potentially months.
The beauty of OFCT lies in its ability to expose bottlenecks and inefficiencies across your entire operation. Is order processing taking too long? Is there a delay in picking items from the warehouse? Is your chosen shipping method sluggish? OFCT brings these issues to light. Furthermore, it can be broken down into its component parts, allowing for a granular analysis of each stage in the fulfillment process. This detailed view helps pinpoint areas for improvement and optimize each step along the way.
Features and Benefits:
Customer-centric: OFCT directly correlates with customer satisfaction. Faster delivery times translate to happier customers, increasing the likelihood of repeat business and positive word-of-mouth referrals.
End-to-End Visibility: It provides a comprehensive view of your entire fulfillment process, often spanning multiple departments and even external partners like suppliers and logistics providers.
Competitive Advantage: In today’s fast-paced world, speed is often a key differentiator. A shorter OFCT can give you a significant edge over your competitors.
Identifies Bottlenecks: OFCT highlights inefficiencies and areas for improvement in your fulfillment process, allowing you to streamline operations and reduce costs.
Cons: Can be impacted by external factors (e.g., weather, third-party logistics), pressure to reduce cycle time can increase costs or errors, different products may have different cycle times, requires sophisticated tracking systems.
Examples of Successful Implementation:
Amazon: Has become synonymous with fast shipping, setting new industry standards with same-day and next-day delivery for millions of products.
Zara: Their fast-fashion model delivers new designs to stores worldwide in just 15 days, drastically faster than the industry average of 2-6 months.
McDonald’s: Revolutionized the fast-food industry by standardizing a 90-second order fulfillment cycle time.
Actionable Tips for Improvement:
Map Your Process: Visually represent your entire fulfillment process to identify bottlenecks and areas for optimization.
Real-Time Tracking: Implement real-time order tracking systems for both customers and your operations team to monitor progress and identify delays.
Segmentation: Segment orders by type and priority to establish realistic and appropriate cycle time targets. A rush order for a critical part will have a different target than a standard order for consumer goods.
Predictive Analytics: Leverage predictive analytics to anticipate demand patterns and position inventory strategically, minimizing delays in fulfillment.
Cross-Functional Teams: Create cross-functional teams involving representatives from all relevant departments (sales, operations, logistics, etc.) to address cycle time improvement holistically.
Learn more about Order Fulfillment Cycle Time to understand how address validation can play a crucial role in optimizing your delivery success rate and minimizing delays caused by incorrect addresses. Optimizing address data upfront is a powerful way to improve OFCT and enhance the customer experience.
By focusing on OFCT, businesses can significantly improve operational efficiency, enhance customer satisfaction, and gain a competitive edge. Whether you’re an e-commerce giant or a local bakery, a streamlined order fulfillment process is key to success in today’s demanding market.
Operational Efficiency Metrics Comparison
Metric
Implementation Complexity 🔄
Resource Requirements 🔄
Expected Outcomes 📊
Ideal Use Cases 💡
Key Advantages ⭐
Overall Equipment Effectiveness (OEE)
Medium to high: requires accurate data collection systems and standardized measurement
Moderate to high: needs automated data collection and sensor integration
Comprehensive production efficiency score highlighting availability, performance, and quality
Customer-focused; highlights end-to-end process bottlenecks
Driving Growth with Data-Driven Decisions
From factory floors to software development, operational efficiency is the engine of business growth. We’ve explored eight key operational efficiency metrics – OEE, Cycle Time, First Pass Yield, Labor Productivity, Capacity Utilization Rate, Inventory Turnover Ratio, Cash Conversion Cycle, and Order Fulfillment Cycle Time – each offering a unique lens into how your business operates. Mastering these metrics empowers you to pinpoint bottlenecks, streamline processes, and ultimately, boost your bottom line. The most important takeaway? Don’t just collect data; use it. By analyzing these metrics, you gain actionable insights that can transform your business.
By mastering these operational efficiency metrics, businesses can leverage the power of data to drive continuous improvement and gain a competitive edge. For a deeper dive into leveraging data for better business decisions, explore resources on data analysis and business intelligence from Kleene.ai.
In today’s rapidly changing landscape, leveraging the power of these operational efficiency metrics isn’t just a good idea—it’s a necessity. Embrace data-driven decision-making and pave the way for a more efficient and profitable future. Ready to take your operational efficiency to the next level? Explore how NILG.AI can help you automate data collection and analysis for these key metrics, unlocking even greater insights and optimization opportunities. Start your journey towards peak performance today!
Master customer retention rate calculation with this practical guide. Learn the formulas, see real-world examples, and get actionable tips for business growth.
We use cookies on our website to give you the most relevant experience by remembering your preferences and repeat visits. By clicking “Accept All”, you consent to the use of ALL the cookies. However, you may visit "Cookie Settings" to provide a controlled consent.
This website uses cookies to improve your experience while you navigate through the website. Out of these, the cookies that are categorized as necessary are stored on your browser as they are essential for the working of basic functionalities of the website. We also use third-party cookies that help us analyze and understand how you use this website. These cookies will be stored in your browser only with your consent. You also have the option to opt-out of these cookies. But opting out of some of these cookies may affect your browsing experience.
Necessary cookies are absolutely essential for the website to function properly. These cookies ensure basic functionalities and security features of the website, anonymously.
Cookie
Duration
Description
cookielawinfo-checkbox-analytics
11 months
This cookie is set by GDPR Cookie Consent plugin. The cookie is used to store the user consent for the cookies in the category "Analytics".
cookielawinfo-checkbox-functional
11 months
The cookie is set by GDPR cookie consent to record the user consent for the cookies in the category "Functional".
cookielawinfo-checkbox-necessary
11 months
This cookie is set by GDPR Cookie Consent plugin. The cookies is used to store the user consent for the cookies in the category "Necessary".
cookielawinfo-checkbox-others
11 months
This cookie is set by GDPR Cookie Consent plugin. The cookie is used to store the user consent for the cookies in the category "Other.
cookielawinfo-checkbox-performance
11 months
This cookie is set by GDPR Cookie Consent plugin. The cookie is used to store the user consent for the cookies in the category "Performance".
viewed_cookie_policy
11 months
The cookie is set by the GDPR Cookie Consent plugin and is used to store whether or not user has consented to the use of cookies. It does not store any personal data.
Functional cookies help to perform certain functionalities like sharing the content of the website on social media platforms, collect feedbacks, and other third-party features.
Performance cookies are used to understand and analyze the key performance indexes of the website which helps in delivering a better user experience for the visitors.
Analytical cookies are used to understand how visitors interact with the website. These cookies help provide information on metrics the number of visitors, bounce rate, traffic source, etc.
Advertisement cookies are used to provide visitors with relevant ads and marketing campaigns. These cookies track visitors across websites and collect information to provide customized ads.